-
Analyzing Microsoft Teams Data
May 25, 2020 / No Comments »

More and more organizations are switching to Microsoft Teams mostly for online meetings. However, Microsoft Teams can deliver much more than that and it will be unjust to compare it with other popular meetings apps. What Microsoft has done with Teams is amazing! Now that I got to study and program Microsoft Teams, I have found it a powerful and extensible platform. For example, Microsoft has provided add-ons for common verticals, such as Teams for Education. Microsoft Teams can be further enriched with apps and can be used to centralize all these Excel spreadsheets that are floating around. And the best of it: most of the Microsoft Teams data is exposed via a single data source: Microsoft Graph API, with the caveat that it is not that easy to get the data out. I've added a new case study "Public School District Gets Insights from Microsoft Teams" that shows how...
-
Showing Database Images in Power BI and Tabular
May 11, 2020 / No Comments »
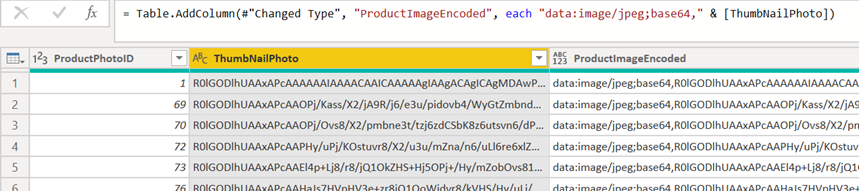
The Power BI image-rendering visualizations, such as Table or Card, expect image links to public servers hosting the images with anonymous permissions. This has obvious shortcomings. Can we load images from a database or Power BI data table? You bet, as Jason Thomas has demonstrated a long time ago. Here are the steps I followed to show the images from the Production.ProductPhoto table in the AdventureWorks2012 (or later) database. If you want to embed a few images into a Power BI data table (instead of an external database), you can convert them manually to Base64 using any of the online image converters, such as https://codebeautify.org/image-to-base64-converter and embed the resulting string into a Power BI data table (the Enter Data feature). Gerhard Brueckl takes this one step further by showing you how to automate the base64 conversion with many images. Import the table with the image column as usual in Power...
-
Power BI Time Adventures
May 10, 2020 / No Comments »

A customer reported that a Power BI date filter/slicer set to a specific date in Date dimension, let's say April 24, 2020, doesn't return some rows from the fact table that match that date. Upon some digging, the data was imported from Dynamics CRM and the source date column had UTC time. Power Query showed Date/Time/Timezone as a data type. However, the developer has converted the corresponding field in the model to the Power BI Date data type to remove the time portion. And indeed, the Data View would show that date as April 24, 2020 (without the time portion). So, why no match? The xVelocity storage engine (the storage engine behind Power BI and Analysis Services Tabular) has only one data type for dates: DateTime. If you convert the field in the data model to Date, it still keeps the time portion (UTC or not) and it doesn't change...
-
Atlanta MS BI and Power BI Group Meeting on May 4th
April 27, 2020 / No Comments »

MS BI fans, please join us online for the next Atlanta MS BI and Power BI Group meeting on Monday, May 4th, at 6:30 PM. Bill Anton will show you how to effectively apply time intelligence to your Power BI data models. For more details, visit our group page and don't forget to RSVP (fill in the RSVP survey if you're planning to attend). Presentation: Power BI Time Intelligence – Beyond the Basics Date: May 4th, 2020 Time 6:30 – 8:30 PM ET Place: Join Microsoft Teams Meeting Learn more about Teams | Meeting options Computer audio is recommended Conference bridge number 1 605 475 4300, Access Code: 208547 Overview: Time-Intelligence refers to analyzing calculations and metrics across time and is the most common type of business intelligence reporting. Power BI has a lot of built in capabilities to help you get started but these alone are not always enough for most...
-
Sentiment Analysis with Power BI
April 22, 2020 / No Comments »

A recent ask from an airline company was to perform sentiment analysis on comments in surveys collected from their customers. Sentiment analysis is a machine learning task that requires natural language processing. In Power BI, we have at least two ways to approach this requirement: Cognitive Services and custom code, such as by using the Python Natural Language Toolkit (NLTK). This post compares the pros and cons of each option based on my impressions so far. Cognitive Services Python Licensing Included in premium or embedded capacity or, provisioned separately with Azure subscription with Power BI Pro Freely available Provisioning Already provisioned with premium or embedded (need to enable AI workloads) Install Python Install pandas, matplotlib, and nltk packages Language detection Yes No Data refresh No gateway required Personal gateway required Enhanced dataset metadata Supported Not supported Cognitive Services Cognitive Services is an Azure PaaS cloud service that supports text analytics...
-
Virtual Power BI Dashboard in a Day (DIAD) on April 30
April 18, 2020 / No Comments »

Register for my next online Power BI Dashboard in a Day (DIAD) workshop and hone your data analytics skills! Drive value for your organization and on the road to recovery after COVID-19. Attend from anywhere for only $199. I'll teach you practical Power BI knowledge and data analytics skills that you can immediately apply to your job. See how Power BI can improve your usability and productivity even further. Date: April 30, 2020 Time: 9:00 AM – 5:00 PM Eastern Time (GMT -4) Price: $199 For more information and to register, go to https://prologika.com/event/diad20200430/
-
Power BI Source Control
April 12, 2020 / No Comments »

Question: How to put Power BI files under source control? Workaround: Power BI Desktop does not currently support source control and it doesn't have an Excel-like extensibility mechanism to let developers take from where Microsoft left off. However, thanks to the enhanced dataset metadata (currently in preview), you can implement a rudimentary source control policy while waiting for third parties to fill in the void by using these steps: In Power BI Desktop, go to File, Options and settings, Options. In the "Preview features" tab, check "Store datasets using enhanced metadata format" if this feature is still in preview. Restart Power BI Desktop when asked. In Power BI Desktop, go to File, Save As and save the file as a Power BI Template (*.pbit) file. This removes the imported data which you don't need for source control and keeps the file small. If you want to put all artifacts (reports,...
-
Two Virtual Workshops to Learn the Power BI Platform
April 5, 2020 / No Comments »
Take advantage of this exclusive opportunity to increase your data IQ from the comfort of your home wherever you are! Register today for my instructor-led digital training events and learn the Microsoft Power Platform consisting of Power BI, Power Apps, and Power Automate. 1-Day Power BI Dashboard in a Day (DIAD) Workshop Date: April 14, 2020 Time: 9:00 AM – 5:00 PM Eastern Time (GMT -4) Price: $199 For more information and to register, go to https://prologika.com/event/diad20200414/ 1-Day Application in a Day (AIAD) Workshop Date: April 21, 2020 Time: 9:00 AM – 5:00 PM Eastern Time (GMT -4) Price: $199 For more information and to register, go to https://prologika.com/event/aaid20200421/ The workshops will be conducted online. Login instructions will be sent to registered attendees before the event.
-
Atlanta MS BI and Power BI Group Meeting on April 6th
April 2, 2020 / No Comments »
MS BI fans, the time has come for a virtual meeting. Please join us online for the next Atlanta MS BI and Power BI Group meeting on Monday, April 6th, at 6:30 PM. I'll show you how business analysts can apply AutoML in Power BI Premium to create predictive models. For more details, visit our group page and don't forget to RSVP (fill in the RSVP survey if you're planning to attend). Presentation: Bringing Predictive Analytics to the Business User with Power BI AutoML (Virtual Meeting) Date: April 6th, 2020 Time 6:30 – 8:30 PM ET Place: Join Microsoft Teams Meeting Learn more about Teams | Meeting options Computer audio is recommended Conference bridge number 1 605 475 4300, Access Code: 208547 Overview: With the growing demand for predictive analytics, Automated Machine Learning (AutoML) aims to simplify this process and democratize Machine Learning so business users can create their own basic predictive...
-
How Much Are You Really Saving?
March 30, 2020 / No Comments »

I helped an ISV a while back with their BI model design. They purchased a data transformation tool for $5,200/year because it's "simple to use" (the tool was designed for self-service data transformation tasks by business analysists) and "relatively inexpensive". The idea was to run the tool manually every time they have new data, import data from text files, transform, and output the data in another set of files, and then load the transformed data in Power BI. However, as it typically happens, the data transformation complexity quickly outgrew this approach. What did the ISV learn along the way? Stage the data – Although it's tempting to do transformations on the fly, data typically must be staged so you can query and manipulate it. This is also required to compare the input dataset with the target dataset and take care of things like Type 2 slowly changing dimensions that may...
Training
 We offer onsite and online Business Intelligence classes! Contact us about in-person training for groups of five or more students.
For more information or to register click here!
Books
 Learn Power BI at your own pace with our latest book Applied Microsoft Power BI. Targeting information workers, data analysts, pros, and developers, It is designed as an easy-to-follow guide for learning how to implement BI solutions spanning the entire personal-team-organizational BI spectrum.

