-
Taking the Most Out of Linked Servers
October 21, 2018 / No Comments »
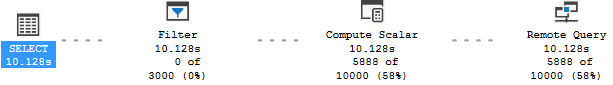
What's the first thing that comes to mind when you hear "linked server"? Performance issues or a snail image, right? Many developers don't like linked servers because they are "slow" although they rarely bother to investigate the underling issue, much less to fix it. Linked servers are a very useful and commonly used feature of SQL Server. They allow SQL Server to query external data sources, such as Oracle and DB2, and to present these data sources as SQL Servers to upstream systems. A query that involves a linked server is called a distributed query. The most common issue with a distributed query is that it doesn't "remote". In other words, while you expect the entire query (or parts of it) to be executed on the remote server, SQL Server downloads the data locally and then performs filters or joins. This could be very expensive with large tables, hence the...
-
Power BI Data Profiling
October 15, 2018 / No Comments »
You know it and I know it. Data quality is a BIG problem that reduces the business value of BI. ETL practitioners will probably recall that SSIS includes a comprehensive Data Profiling Task but it is somewhat difficult to set up, especially if you wanted to profile multiple tables. It saves the results in an xml file and then you could use the Data Profile Viewer to visualize the results. Can we do something like this in Power BI? Starting with Power BI Desktop (October 2018) release you can. Well, sort of. Once you enable the column profiling preview feature, open the query behind any table and enable these options in the View ribbon. You'll get basic statistics showing the percentages of Valid, Error, and Empty values out of the sample size (the first 1,000 values). Here are definitions of these categories: Valid - Non-Error and Non-Empty values out of...
-
Kudos to Tabular Editor!
October 11, 2018 / No Comments »

What tool do you use for Analysis Services Tabular development? SSDT right, what else? Here is a little secret. I almost don't use SSDT anymore, except for limited tasks, such as importing new tables and visualizing relationships. I switched to a great community tool – Tabular Editor and you should too if you're frustrated with the SSDT Tabular Designer. Back in 2012 Microsoft ported the Power Pivot designer to SSDT to let BI practitioners implement Tabular models. This is why you still get weird errors that Excel has encountered some error. Microsoft haven't made any "professional" optimizations despite all the attention that Tabular gets. As a result, developers face: Performance issues – As your model grows in complexity, it gets progressively slower for even simple changes, such as renaming columns. The problem of course is that any change results in a commit operation to the workspace database. SSDT requires a...
-
ADF or SSIS, That Is the Question
October 2, 2018 / No Comments »
Microsoft introduced Azure Data Factory (ADF) in 2015 to handle a specific scenario: tumbling window loads for Hadoop and other big data systems for internal MS usage. Then a need arose for a PaaS public-facing data integration platform which led to an interesting dilemma: SSIS or something else? Since SSIS wasn't designed to scale out in the cloud, ADF rose to the challenge. I could argue that a better approach would have been migrating the SSIS design experience to the cloud to retain existing skills and make thousands of BI developers feel at home, as Microsoft did with SQL Server Database Engine and SSAS, but it's a moot point now. So, ADF was incorrectly positioned as "SSIS for the Cloud" and unfortunately once that message made it out there was a messaging problem that Microsoft has been fighting ever since. Like Azure ML, on the glory road to the cloud...
-
Power BI Features Report
September 26, 2018 / No Comments »
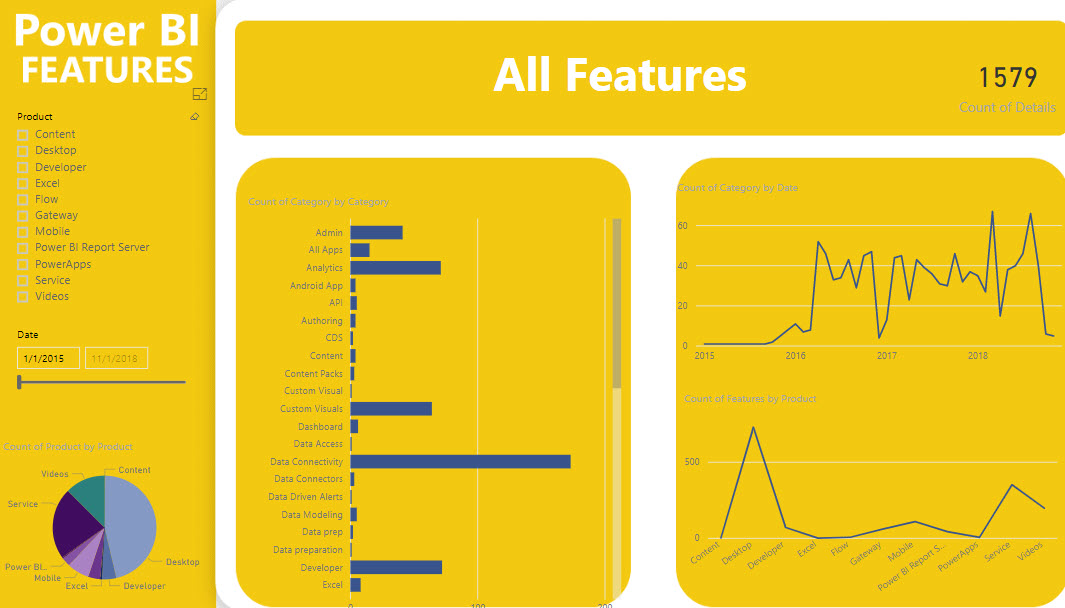
Want to know what Power BI features were released in a certain time period? Check out the Power BI Features report. After some delay, you should see the report embedded on the page but please be patient. If no patience, you can also download the pbix file from the same page. Then, use the slicer on the first page to filter your date range. In the "Count of Category" bar chart, right-click the category and then click See Records to see to the actual features. Once you drill through the category, there is a link next to each feature that redirects you to the corresponding blog to learn more.
-
The Cost of xVelocity Relationships
September 24, 2018 / No Comments »

How expensive is an xVelocity relationship? The answer depends on several factors, such as column cardinality, DAX calculations, and query itself. But it general, a relationship can add a significant overhead. Consider two tables: Customer (7.1 million rows) and Account Snapshot (187 million rows) and a relationship 'Account Snapshot'[CustomerKey] -> Customer[CustomerKey]. I'll use two queries for the test. The Relationship query uses the 'Account Snapshot'[CustomerKey]->Customer[CustomerKey] relationship, while the No Relationship query scans directly the Account Snapshot table bypassing the relationship. Relationship No Relationship EVALUATE CALCULATETABLE ( ADDCOLUMNS ( FILTER ( VALUES ( 'Customer'[CustomerKey], ... ), 'Customer'[CustomerKey] IN { 731102730822895922 } ), "Balance", [Balance] ), FILTER ( VALUES ( 'Date'[Date] ), 'Date'[Date] = DATE ( 2018, 3, 31 ) ) ) EVALUATE CALCULATETABLE ( ADDCOLUMNS ( FILTER ( VALUES ( 'Account Snapshot'[CustomerKey], ... ), 'Account Snapshot'[CustomerKey] IN { 731102730822895922} ), "Balance", [Balance] ), FILTER ( VALUES ( 'Date'[Date] ), 'Date'[Date] = DATE (...
-
Another Successful SQL Saturday!
September 22, 2018 / No Comments »

Kudos to all the hard working individuals that made SQL Saturday BI (Atlanta) a success! It was great meeting many BI fans.
-
2-Day Applied DAX with Power BI Workshop in Atlanta (Oct 15-16)
September 18, 2018 / No Comments »
Struggling with DAX? Data Analysis Expressions (DAX) is the expression language of Power BI, Power Pivot, and Analysis Services Tabular. It's very powerful but it's usually perceived as complex and requiring a steep learning curve. Taught by an established expert, this two-day workshop is designed to help you become proficient with DAX. Think of this workshop as advanced Power BI training. Reserve your seat today to attend this insightful 2-day workshop for only $999, when Teo Lachev (CEO of Prologika and Microsoft Data Platform MVP) teaches you the necessary DAX skills that you can immediately apply to your job. Event Summary Date: October 15 and 16 Time: 8:30 AM - 5 PM Location: Microsoft Office in Alpharetta Catering: lunch provided Syllabus: available here Price: $999 (use coupon SQL201810 for an instant 5% discount if you sign up two or more attendees from your company) For more information and to register, go to http://bit.ly/daxworkshop201810 Key Benefits...
-
Prologika at SQL Saturday BI in Atlanta
September 16, 2018 / No Comments »

SQL Saturday BI in Atlanta is around the corner. Prologika will deliver two sessions at this event on September 22nd: Bridge Analytics and Developer Worlds with Power BI and PowerApps by your humble correspondent, starting at 9 AM One of the Power BI most prominent strengths is that it's a part of the much broader Microsoft Data Platform that spans various on-premises and cloud offerings for data storage, processing, and analysis. Join me to learn how to integrate Power BI with PowerApps and discover exciting new possibilities that redefine the meaning of a report. During this entirely hands-on, no-slides session, I'll walk you through the steps to implement a popular report requirement for writeback, that Power BI doesn't natively support. Data Quality - Plain & Simple by our master data management guru, Neal Waterstreet, starting at 12:30 PM Data quality is a subject that comes up over and over again in...
-
New “Applied DAX with Power BI” Workshop
September 12, 2018 / No Comments »

Data Analysis Expressions (DAX) is the expression language of Power BI, Power Pivot, and Analysis Services Tabular. It's very powerful but it's perceived as complex, requiring a steep learning curve. I'm excited to announce a new 2-day "Applied DAX with Power BI" workshop that I designed to help you become proficient with DAX. You'll learn practical skills that will help you tackle a wide range of reporting requirements. We'll start with DAX fundamentals, such as calculated columns and measures, and then progress to more advanced concepts, including such as context transitions, variables, filters, time intelligence, advanced relationships, row-level security, query optimization, and much more. Think of this workshop as Advanced Power BI and the next level from my "Applied Power BI" class. The target audience is data analysts and BI developers wanting to hone their DAX skills with Power BI, Power Pivot, or Tabular. Here is my entire training catalog...
Training
 We offer onsite and online Business Intelligence classes! Contact us about in-person training for groups of five or more students.
For more information or to register click here!
Books
 Learn Power BI at your own pace with our latest book Applied Microsoft Power BI. Targeting information workers, data analysts, pros, and developers, It is designed as an easy-to-follow guide for learning how to implement BI solutions spanning the entire personal-team-organizational BI spectrum.

