-
Atlanta MS BI and Power BI Group Meeting on April 1st
March 26, 2019 / No Comments »

MS BI fans, join us for the next Atlanta MS BI and Power BI Group meeting on April 1, Monday, at 6:30 PM at the Microsoft office in Alpharetta. Considering all the the momentum behind machine learning, the main presentation will be "Microsoft Citizen Data Science with Power BI" by Stacey Jones, a Principal Data Solution Architect at Microsoft. I'll do a brief overview of the brand new Modeling tab in Power BI Desktop. Vacation Express will sponsor the event. For more details, visit our group page and don't forget to RSVP (use the RSVP survey on http://atlantabi.pass.org if you're planning to attend). Presentation: Microsoft Citizen Data Science with Power BI Date: April 1 2019, Monday Time 6:30 – 8:30 PM ET Place: Microsoft Office (Alpharetta) 8000 Avalon Boulevard Suite 900 Alpharetta, GA 30009 Overview: Are you curious about Data Science? Are you a Data Scientist? If you answered yes and no to these questions...
-
Implementing Input Table in DAX Query
March 7, 2019 / No Comments »
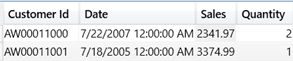
Scenario: If you want to pass an input table to a DAX query. For example, you might have an application that lets the user specify a subset of customers and as-of dates for each customer. Your query needs to calculate certain metrics, such as Sales, for the list of customers but as of the user-specified date for each customer, and potentially other parameters. It's impractical to save these parameters in a physical table in your database because this requires a processing task. You may also want to avoid Analysis Services placing locks on the database for each refresh and thus blocking pending queries. Instead, you want to simply pass a collection of all the parameters the query needs to do its job, inside the query. Solution: DAX supports static tables using the DATATABLE function, but the resulting data table is very limited in its support of features. First, you can't...
-
DAX Calculation Groups
March 5, 2019 / No Comments »
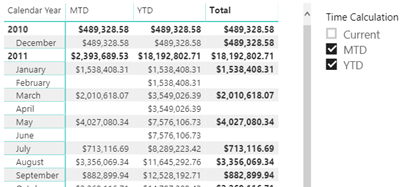
Just when I started thinking that there won't be any new BI features in SQL Server 2019, Christian Wade announced DAX calculation groups in CTP 2.3. His excellent post helped me try them out with Tabular Editor and Power BI Desktop and whip out this cool report. As Chris Webb pointed out, DAX calculation groups let us implement time calculations as in Multidimensional with a "shell" time dimension. They probably won't help you reducing the number of measures because you'd still need to flatten the "shell" dimension for maximum flexibility and avoid forcing the user to use the Time Calculations slicer to select the time calculations they want on the report. So, you would still have to project Sales Amount YTD as a separate measure: [Sales Amount YTD] = CALCULATE (SUM ( 'Reseller Sales'[Sales Amount] ), 'Time Intelligence'[Time Calculation] = "YTD") What calculation groups help with is avoiding copying and...
-
First Look at Power BI AutoML
March 3, 2019 / No Comments »
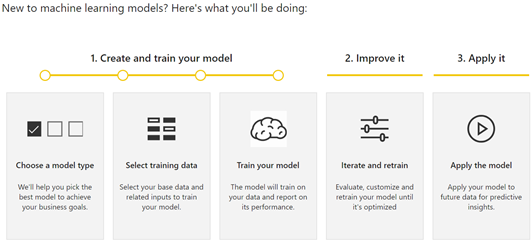
In my previous "First Look at the New Power BI Integration with Azure ML" blog, I showed you how Power BI will make it very easy to integrate it with Azure Machine Learning and Cognitive Services. Data scientists today have plenty of options to create predictive models but all of them have one thing in common: expertise in data science and statistics. The promise of AutoML is to bring predictive analytics to data analysts just like self-service BI brought analytics to business users. Let's see how AutoML works based on what's in the private preview (the usual disclaimer is that things will probably change). To start with, AutoML requires a dataflow (a note to Microsoft here is that AutoML will become more pervasive if it's available in Power BI Desktop and it doesn't require a premium capacity). In the private preview, AutoML requires the following steps. Presumably. the first (and most...
-
First Look at the New Power BI Integration with Azure ML
March 2, 2019 / No Comments »
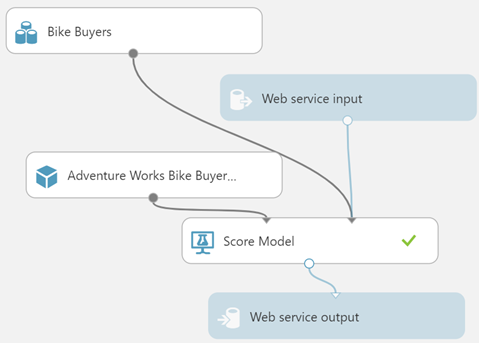
Currently, Power BI doesn't integrate natively with Azure ML so you must resort to using the Web connector to call the experiment's web service. I demonstrate how you can do this in a singleton way (one row at a time) in chapter 11 of my latest Power BI book (you can download the code from the book page). Microsoft announced several forthcoming Machine Learning enhancements, including integration with Cognitive Services and Azure ML, and the new Auto ML features (skip to 1:08:30). In this blog, I'll review the Power BI integration with Azure ML, which is currently in private preview but expected to be available for public preview soon. I'll use the Adventure Works Bike Buyer Azure ML predictive model (explained in more detail in my book). The predictive model is simple. The model is trained with data from the vTargetMail view in the AdventureWorksDW database and predicts the probability...
-
Atlanta MS BI and Power BI Group Meeting on March 4th
February 26, 2019 / No Comments »
MS BI fans, join us for the next Atlanta MS BI and Power BI Group meeting on March 4th, Monday, at 6:30 PM at the Microsoft office in Alpharetta. The main presentation will be "Power BI Architecture" by Paco Gonzalez from SolidQ. Eric Flamm will do us Prototypes with Pizza on configuring a Power BI visual for mobile layout. SolidQ will sponsor the event. For more details, visit our group page and don't forget to RSVP (use the RSVP survey on the group page) if you're planning to attend. Presentation: Power BI Architecture Date: March 4, 2019, Monday Time 6:30 – 8:30 PM ET Place: Microsoft Office (Alpharetta) 8000 Avalon Boulevard Suite 900 Alpharetta, GA 30009 Overview: Having the right architecture is key to the adoption of Power BI, and to make the most of your business intelligence solution. This session guides you through different Power BI architectures, such as Direct Query, Import, Connect Live, Composite...
-
2019 Gartner Magic Quadrant for Analytics and Business Intelligence Platforms
February 14, 2019 / No Comments »
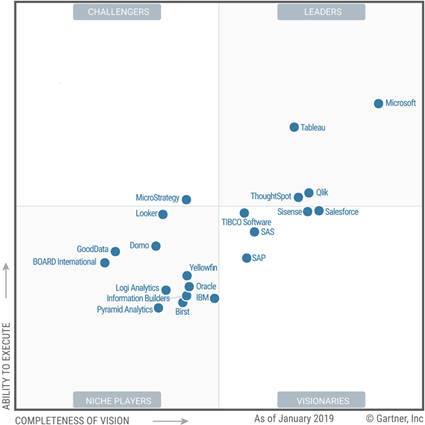
The 2019 Gartner Quadrant for Analytics and BI Platforms is out and Microsoft BI aficionados like your humble correspondent have all the reasons to rejoice. Say whatever you want about Gartner but the quadrant is a great testimonial for Power BI and I think the highest score was overdue. Microsoft still has tons of work on the visualization side of things but I'm glad that Gartner recognized the business value of Power BI which exceeds by far any other BI tool on the market. A few comments on the cautions in the report: Differences in on-premises and cloud service with Azure cloud only – This is about the discrepancies between Power BI and Power BI Report Server which I discussed last year. Revisiting this, I'd like to know how many customers have complained. In my practice, I don't see much interest in Power BI Report Server for deploying Power BI reports...
-
Atlanta MS BI and Power BI Group Meeting on February 4th
January 30, 2019 / No Comments »
MS BI fans, join us for the next Atlanta MS BI and Power BI Group meeting on February 4th, Monday at 6:30 PM at the Microsoft office in Alpharetta. The main presentation will be "Azure Data Lake for First Time Swimmers" by Samara Soucy from Innovative Architects. Julies Smith will do us Prototypes with Pizza on "Python Fuzzy Wuzzy for Master Data Identity Mapping". Innovative Architects will sponsor the event. For more details, visit our group page and don't forget to RSVP (use the RSVP survey on the group page) if you're planning to attend. Presentation: Azure Data Lake for First Time Swimmers Date: February 4, 2019, Monday Time 6:30 – 8:30 PM ET Place: Microsoft Office (Alpharetta) 8000 Avalon Boulevard Suite 900 Alpharetta, GA 30009 Overview: Data Lake may be the hot new way to store data for reporting, but it can be scary if you've never dealt with one. If you have...
-
How Filters Affect DAX Measures
January 26, 2019 / No Comments »

xVelocity (the storage engine behind Tabular, Power BI and columnstore indexes) is an in-memory columnar database, and it's such it's not suitable for detail-level reports, such as transaction-level reports. I wrote about performance implications with xVelocity and detail-level reporting here and here. In general, the lower the report grain and the more columns you add to the report (customer first name, last name, invoice number, etc.), the slower the performance will be as more and more columns would need to be scanned and cross-joined. A recent Tabular project brought another twist. Most measures (about 250 total) were produced on top of a biggish snapshot table (250 million rows) and Customer table (12 million rows). As a best practice, base measures were created with common filters and then other measures would piggy back on the base measures like Russian dolls. It's a best practice because if you must change a filter,...
-
T-SQL, Power Query, or DAX?
January 20, 2019 / No Comments »

I taught my Applied Power BI class last week to a group of smart data analysts. All of them were knowledgeable of T-SQL, which they have been using extensively for years to shape and transform the data and produce SSRS, Qlik and now Power BI reports. They haven't previously used Power Query, but they liked my overview of its features. However, they were rightfully confused when to use T-SQL, Power Query, or DAX. Starting with the data source and moving up the chain, Power BI lets you use expressions in: Data source (custom SQL Query, SQL view) Power Query DAX calculated columns DAX measures (the uppermost level) My advice is to invest time and learn all these capabilities. When you have diverse skills, you can use the best tool for the task at hand. Although is hard to generalize as every data transformation is different, I recommend you shape the...
Training
 We offer onsite and online Business Intelligence classes! Contact us about in-person training for groups of five or more students.
For more information or to register click here!
Books
 Learn Power BI at your own pace with our latest book Applied Microsoft Power BI. Targeting information workers, data analysts, pros, and developers, It is designed as an easy-to-follow guide for learning how to implement BI solutions spanning the entire personal-team-organizational BI spectrum.

