-
A First Look at Microsoft Fabric: Recap
July 30, 2023 / No Comments »

Did I disappoint you? Or leave a bad taste in your mouth? You act like you never had love And you want me to go without U2 In previous posts, I shared my initial impression of the recently announced Microsoft Fabric and its main engines. Now that we have the Fabric licensing and pricing, I'm ready to wrap up my review with a few parting notes. Here is how I plan to position Fabric to my clients: Enterprise clients These clients have complex data integration needs. More than likely, they are already on a Power BI Premium contract and highly-discounted pricing model that is reviewed and renewed annually with Microsoft. Given that Fabric can be enabled on premium capacities, you should definitely consider it selectively when it makes sense. For now, I believe a good case can be made for data lake and lakehouse if that's your thing. Now you...
-
Fabric Semantic Modeling: The Good, the Bad, and the Ugly
July 14, 2023 / No Comments »
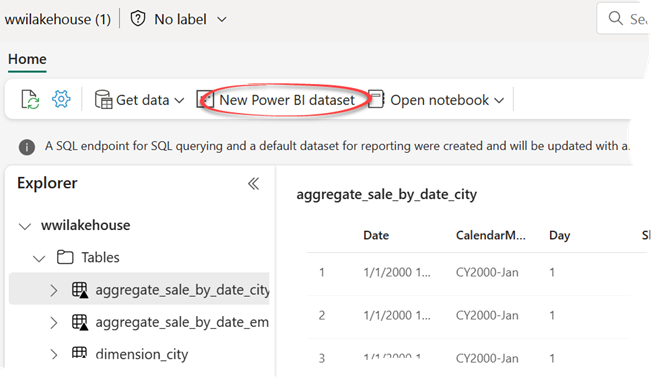
In retrospect, I'd say I owe 50% of my BI career to Analysis Services and its flavors: Multidimensional, Tabular, and later Power BI. This is why I closely follow how this technology evolves. Fast forwarding to Fabric, there are no dramatic changes. Unlike the other two Fabric Engines (Lakehouse and Warehouse), Power BI datasets haven't embraced the delta lake file format to store its data yet. The most significant change is the introduction of a new Direct Lake data access mode alongside the existing Import and DirectQuery. The Good Direct Lake will surely enable interesting scenarios, such as real-time BI on top of streaming data. It requires Parquet delta lake files and therefore it's available only when connecting to the Lakehouse managed area (Tables folder) and Warehouse tables. Given that Parquet is a columnar format, which is what Tabular VertiPaq is, basically Microsoft has changed the engine to read Parquet...
-
Power BI Projects and Git Integration: The Good, the Bad, and the Ugly
July 9, 2023 / No Comments »
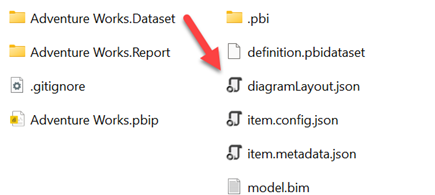
Is it getting better? Or do you feel the same? Will it make it easier on you now? You got someone to blame U2 Likely influenced by the Gartner's Fabric vision, Microsoft Fabric is eclipsing all things Power BI nowadays to the extent of replacing the strong Power BI brand and logo with Fabric's. Now that the red star Synapse has imploded into a black hole, Fabric has taken its place and it's engulfing everything in its path. But to digress from Fabric, let's take a look at two developer-oriented and frequently requested features that fortunately doesn't require Fabric: Power BI Desktop projects and workspace integration with Git. The video in the link is a good starting point to understand how these features work. Basically, the first feature lets you save a Power BI Desktop file as a *.pbip file which generates a set of folders with human-readable text files,...
-
Fabric Data Integration: The Good, the Bad, and the Ugly
July 8, 2023 / No Comments »
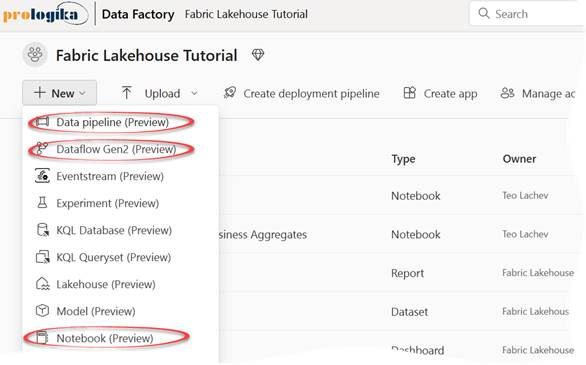
Oops, I did it again I played with your heart Got lost in the game… Britney Spears In previous posts, I shared my thoughts about Fabric OneLake, Lakehouse, and Data Warehouse. They are of course useless if there is no way to get data in and out of Fabric. Data integration and data quality is usually the most difficult part of implementing a BI solution, accounting for 60-80% of the overall effort. Therefore, this post is about Fabric data integration options. Fabric supports three options for automated data integration: Data Pipeline (Azure Data Factory pipeline), Dataflow Gen2 (Power BI dataflow), and Notebook (Spark). I summarize these three options in the following table, which loosely resembles the Microsoft comparison table but with my take on it. Data pipeline (ADF pipeline/copy activity) Dataflow Gen2 (Power BI dataflow) Notebook (Spark) Primary user BI developer Business analyst Data scientist, Developer Patterns supported ETL/ELT ETL...
-
Atlanta Microsoft BI Group Meeting on July 11th (Azure OpenAI – Answers to Your Natural Language Questions)
July 5, 2023 / No Comments »

Atlanta BI fans, please join us for the next meeting on Tuesday, July 11th, at 6:30 PM ET. Stacey Jones (Cross Solution Architect at Microsoft) will join us in person to present OpenAI and Copilot. Your humble correspondent will demo the newly released PBI Desktop project format. For more details and sign up, visit our group page. PLEASE NOTE A CHANGE TO OUR MEETING POLICY. EFFECTIVE IMMEDIATELY, WE ARE DISCONTINUING ONLINE MEETINGS VIA TEAMS. THIS GROUP MEETS ONLY IN PERSON. WE WON’T RECORD MEETINGS ANYMORE. THEREFORE, AS DURING THE PRE-PANDEMIC TIMES, PLEASE RSVP AND ATTEND IN PERSON IF YOU ARE INTERESTED IN THIS MEETING. Presentation: Azure OpenAI - Answers to Your Natural Language Questions Date: July 11th (Please note that because of the July 4th holiday, this meeting is on Tuesday) Time: 18:30 – 20:30 ET Level: Intermediate Food: As of now, food won’t be available for this meeting. We...
-
Fabric Data Warehouse: The Good, The Bad, and the Ugly
July 3, 2023 / No Comments »
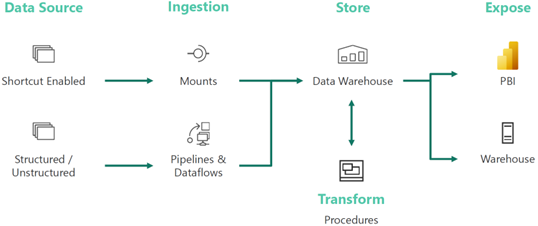
"Patience my tinsel angel, patience my perfumed child One day they'll really love you, you'll charm them with that smile But for now it's just another Chelsea [TL: BI] Monday" Marrillion Continuing our Power BI Fabric journey, let's look at another of its engines that I personally care about – Fabric Warehouse (aka as Synapse Data Warehouse). Most of my real-life projects require integrating data from multiple data sources into a centralized repository (commonly referred to as a data warehouse) that centralizes trusted data and serves it as a source to Power BI and Analysis Services semantic models. Due to the venerable history of relational databases and other benefits, I've been relying on relational databases powered by SQL Server to host the data warehouse. This usually entails a compromise between scalability and budget. Therefore, Azure-based projects with low data volumes (up to a few million rows) typically host the warehouse...
-
Fabric Lakehouse: The Good, The Bad, and the Ugly
June 25, 2023 / No Comments »
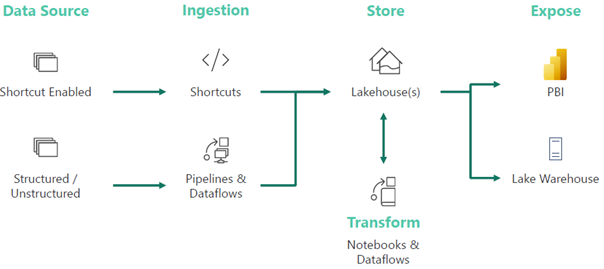
"Hey, I got this lake house, you should see it It's only down the road a couple miles I bet you'd feel like you're in Texas I bet you'll wanna stay a while" Brad Cox Continuing our Fabric purview, Lakehouse is now on the menu. Let's start with a definition. According to Databricks which are credited with this term, a data lakehouse is "a new, open data management architecture that combines the flexibility, cost-efficiency, and scale of data lakes with the data management and ACID transactions of data warehouses, enabling business intelligence (BI) and machine learning (ML) on all data." Further, their whitepaper "argues that the data warehouse architecture as we know it today will wither in the coming years and be replaced by a new architectural pattern, the Lakehouse, which will (i) be based on open direct-access data formats…" In other words, give us all of your data in...
-
Fabric OneLake: The Good, the Bad, and the Ugly
June 3, 2023 / No Comments »
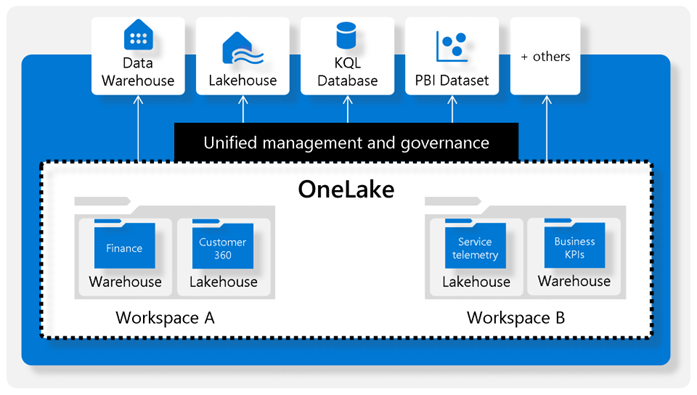
To know a tool is to know its limitations – Teo's proverb In a previous post, I shared my overall impression of Fabric. In this post, I'll continue exploring Fabric, this time sharing my thoughts on OneLake. If you need a quick intro to Fabric OneLake, the Josh Caplan's "Build 2023: Eliminate data silos with OneLake, the OneDrive for Data" presentation provides a great overview of OneLake, its capabilities, and the vision behind it from a Microsoft perspective. If you prefer a shorter narrative, you can find it in the "Microsoft OneLake in Fabric, the OneDrive for data" post. As always, we are all learning and constructive criticism would be appreciated if I missed or misinterpreted something. What's Fabric OneLake? In a nutshell, OneLake is a Microsoft-provisioned storage where the ingested data and the data from the analytical (compute) engines are stored (see the screenshot below). Currently, PBI datasets (Analysis...
-
Atlanta Microsoft BI Group Meeting on June 5th (How to Fix an Inherited Power BI Report)
May 29, 2023 / No Comments »

Please join us for the next meeting on Monday, June 5th, at 6:30 PM ET. Kristyna Hughes (Senior data & analytics consultant at 3Cloud will join us remotely and share best practices for dissecting a complicated and broken Power BI report and a checklist of how to fix it. Improving will sponsor the meeting. Your humble correspondent will demonstrate how Power BI can integrate better with SharePoint and OneDrive. For more details and sign up, visit our group page. WE NOW MEET BOTH IN-PERSON AND ONLINE. WE STRONGLY ENCOURAGE YOU TO ATTEND THE EVENT IN PERSON FOR BEST EXPERIENCE AND BECAUSE AN EMPTY AUDIENCE IS DISCOURAGING TO SPEAKERS AND SPONSORS. ALTERNATIVELY, YOU CAN JOIN OUR MEETINGS ONLINE VIA MS TEAMS. WHEN POSSIBLE, WE WILL RECORD THE MEETINGS AND MAKE RECORDINGS AVAILABLE HERE. PLEASE RSVP ONLY IF COMING TO OUR IN-PERSON MEETING AND PLAN TO EAT Presentation: How to Fix an...
-
A First Look at Microsoft Fabric: The Good, the Bad, and the Ugly
May 28, 2023 / No Comments »

"May you live in interesting times" – Chinese proverb Microsoft Fabric is upon us with a grand fanfare. You can get a good overview of its vision and capabilities by watching the Microsoft Fabric Launch Digital Event (Day 1) and Microsoft Fabric Launch Digital Event (Day 2) recordings. Consultants and experts are extolling its virtues and busy fully aligning with Microsoft. There is a lot of stuff going on in Fabric and I'm planning to cover the technologies I work with and care about in more detail in future posts as Microsoft reveals more what's under the kimono. This post is about my overall impression on Fabric, in an attempt to cut through the dopamine and adrenaline-infused marketing hype. As always, please feel free to disagree and provide constructive criticism. The Good Let's just say that after 30 years working with Microsoft technologies, I'm very, very skeptical when I hear...

 We offer onsite and online Business Intelligence classes! Contact us about in-person training for groups of five or more students.