-
The Aggregate Function
October 29, 2009 / No Comments »
Reporting Services supports an Aggregate function to retrieve aggregated values directly from the data provider if the provider supports this feature. The Aggregate function is especially useful with retrieving data from Analysis Services because it may be difficult if not impossible to recreate aggregated values on the report, such as when the cube script overwrites the server aggregates. It's easy to use the Aggregate function. Just replace the default Sum() aggregate function with Aggregate() in the group subtotals. When you do this, the Analysis Services provider brings in additional rows that include the server aggregates which the report displays in the group subtotals. Recently, I came across a report that would return the following exception after attempting to use Aggregate(). The Value expression for the text box ''<textbox.' uses Aggregate with an invalid scope parameter. I couldn't find anything wrong with the way Aggregate() is used because it was in...
-
Why We Can’t Connect Anymore?
October 28, 2009 / No Comments »
New OS (Windows 7 in this case) and new issues when trying to connect to Analysis Services on a remote server. I installed Windows 7 and added it to a corporate domain. I can use SSMS to connect to some SSAS servers but there was one server (the most important of course) which refused the connections with the following dreadful message which I am sure you've seen somewhere along the line: TITLE: Connect to Server ------------------------------ Cannot connect to <servername>. ------------------------------ ADDITIONAL INFORMATION: The connection either timed out or was lost. (Microsoft.AnalysisServices.AdomdClient) ------------------------------ Unable to read data from the transport connection: An existing connection was forcibly closed by the remote host. (System) ------------------------------ An existing connection was forcibly closed by the remote host (System) I was able to connect to that server from other non-Windows 7 machines so I narrowed the issue to Windows 7. Interestingly, running the...
-
Applied Analysis Services 2008 Online Training Class with Teo Lachev
October 24, 2009 / No Comments »

We are excited to announce the availability of an online Analysis Services 2008 class – no travel, no hotel expenses, just 100% content delivered right to your desktop! This intensive 3-day online class (14 training hours) is designed to help you become proficient with Analysis Services 2008 and acquire the necessary skills to implement OLAP and data mining solutions. Learn how to build an Adventure Works cube from scratch. Use the opportunity to ask questions and study best practices.. Applied Analysis Services 2008 Online Training Class with Teo Lachev Date: November 16 – November 18, 2009 Time: Noon – 4:30 pm EDT; 9 am – 1:30 pm PDT 14 training hours total for only $799! Attend this class for only $799 and get a free unrestricted e-book copy of the book Applied Analysis Services 2005 by Teo Lachev! For more information or to register click here!
-
Phantom URLs
October 20, 2009 / No Comments »

An interesting "issue" popped up today. I did a fresh install of Windows 7 on my brand new HP 8530w laptop, which is a great laptop BTW. I install SQL Server 2008 followed by SP1 only to find that the Web Service URL and Report Manager URL don't show up in the Reporting Services Configuration Manager. The report sever would run just fine on http://localhost/reportserver and the URLs were registered correctly in the rsreportserver.config. I went as far as whipping out some WMI code and it would return the URLs as it should. But the darn URLs won't show up. Not to mention that another user has recently reported the exact same issue to me. A bug? I started thinking of re-installing SQL Server. Then, a Eureka moment! As with most things, there was an easy explanation. For some reason, Windows 7 has set the system font size to be 125%. Resetting it to...
-
Intelligencia for Silverlight
October 19, 2009 / No Comments »
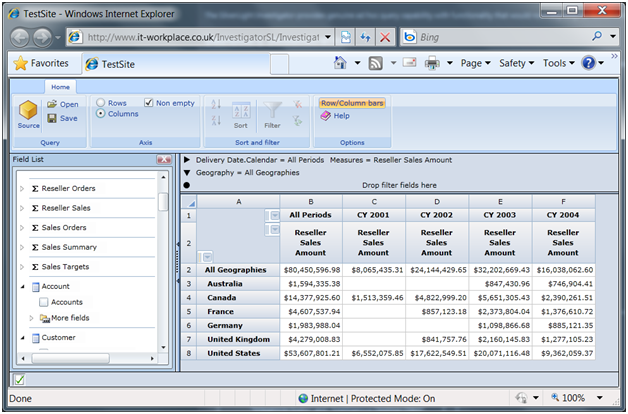
After retiring Office Web Components (OWC), which can hardly can pass the web test as it is implemented as an ActiveX control, Microsoft left developers with no web-based browser for Analysis Services. True, for those who can afford the hefty price tag, Microsoft Office SharePoint Server (MOSS) supports server-side Excel spreadsheets that render to HTML. However, while Excel rules the Windows-based OLAP browser space, HTML-based Excel spreadsheets with limited filtering can hardly meet the demand for web-based interactive reporting. Then, there is an option to author Reporting Services OLAP reports but outside limited interactive features their layout is pretty much fixed at design time. What's really needed is a Silverlight Analysis Services control that ships with Visual to let developers embed an Excel-like Analysis Services browser into their ASP.NET applications. You need this control and I need it but it's not coming anytime soon. Meanwhile, third-party vendors rush in to...
-
Aggregating Many-to-Many Relationships
September 18, 2009 / No Comments »
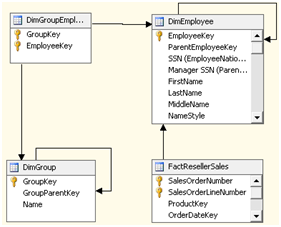
Relax…this blog is all about Analysis Services and not about polygamy or something worse. SSAS 2005 went beyond the "classic" OLAP model by introducing flexible dimension-to-measure group relationships, including many-to-many, referenced, fact relationships. M2M relationships can solve some nagging business problems. For example, in a recent project where we had to implement a financial cube, there was a requirement that a G-L account can belong to multiple account groups. This is a classic M2M scenario which can be elegantly solved by introducing a M2M relationship. Adventurizing this, let's take a look at this schema. Here, I changed the Adventure Works schema by adding a DimGroup and DimGroupEmployee tables. The DimGroup dimension is a parent-child dimension that lets the end user slice data by territory. An employee can be associated with one or more territories (think of a sales manager that covers multiple territories. This M2M relationship (groups-territories) is resolved via...
-
Passing Multivalued Parameters in SQL Server 2008
September 11, 2009 / No Comments »
One year after submitting this small article, SQL Server Magazine has finally published it. This article demonstrates how you can use table-value parameters (TVPs), a new feature in SQL Server 2008, to let you pass multivalued parameters from a report to a stored procedure. The code can be downloaded from the SQL Server Magazine site or from here.
-
Heat Maps as Reports
August 30, 2009 / 4 Comments »
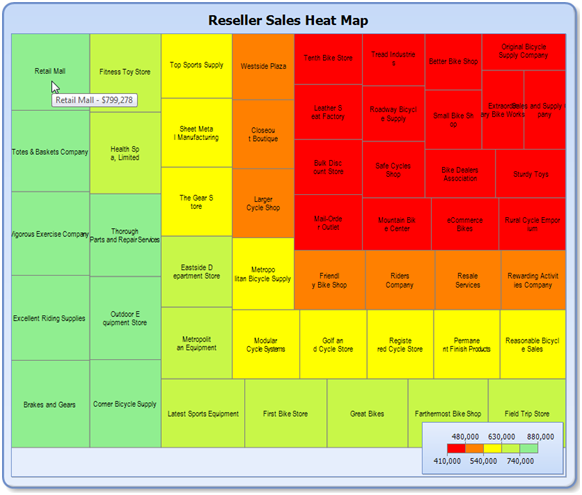
Continuing my intrepid journey through the new Reporting Services R2 enhancements, in this blog I'll demonstrate some of the cool map features. As you've probably heard, R2 brings a brand new map control that lets you visualize spatial data on your reports. Since mapping is the one of the major enhancements in R2, there will be plenty of resources to cover it in details. For example, Robert Bruckner has written a great blog to get you started with mapping. The SSRS R2 forum adds more resources. But what if you don't need to visualize geospatial data, such as restaurants in the Seattle area? You shouldn't bother with the map, right? Not so fast. What's interesting is that the map supports the two spatial data types in SQL Server: geography and geometry. The latter lets you visualize everything that can be plotted on the planar coordinate system. That's pretty powerful when...
-
Yet Another Relative Dates Implementation
August 20, 2009 / 16 Comments »
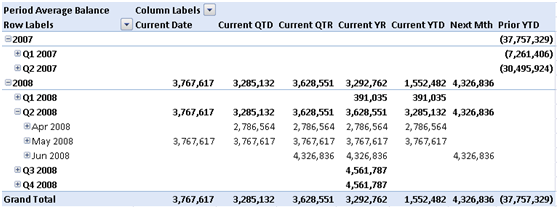
Yet another relative dates implementation in an Analysis Services cube. So far, I've implemented two. But I'm now starting a project to implement an accounting (G/L) cube and the traditional relative date approach where each relative date is calculated for the current member in the Date dimension doesn't fly anymore. Heck, the business analyst even found the excellent "Translating Cognos PowerPlay Transformer Relative Date Functionality into SQL Server Analysis Services (SSAS)" whitepaper by David Greenberg and told me that's exactly what they need. That's what happens when you have smart users. Power Pivot anyone? While the business users are not empowered yet, let me share how I implemented this approach. What's Needed? The difference now is that we want to drill down from each relative date to the periods that the relative date spans. Let's take a look at the screenshot below. The cube sets the default member of the...
-
Reporting Services 2008 Online Training Class with Teo Lachev
August 17, 2009 / No Comments »

There is still time to sign up for our Applied Reporting Services 2008 class with Teo Lachev. This three-day intensive event teaches you the knowledge and skills you need to master Reporting Services to its fullest. No travel, no hotel expenses, just 100% in-depth SSRS training delivered right to your desktop! Applied Reporting Services 2008 Online Training Class with Teo Lachev Date: August 31 – September 2, 2009 Time: Noon – 4 pm EDT; 9 am – 1 pm PDT 12 training hours total for only $799! Attend this class for only $799 and get a free paper copy of the book Applied Microsoft SQL Server 2008 Reporting Services by Teo Lachev! For more information or to register click here!

 We offer onsite and online Business Intelligence classes! Contact us about in-person training for groups of five or more students.