-
Invisible Cubes
March 7, 2009 / 2 Comments »
I had a head-scratcher the other day. All of a sudden, SQL Server Management Studio stopped showing the cubes in the dropdown of the MDX Query tab although MDX queries and reports would execute just fine. The Reporting Services MDX Query Designer would complain with "No cubes found" error when I attempted to launch it from the dataset properties. This strange behavior coincided with installing SQL Server 2008 SP1 CTP, so I was quick to find a culprit. My suspicion was that the SSAS Windows authentication was failing was some reason although the SQL Server Profiler would show that the right Windows identity was connecting to the database. To troubleshoot this further, I issued the following schema rowset query when connected to the SSAS database in SSMS: select * from $system.mdschema_cubes Interestingly, the query would return a list of the database dimensions (SSAS treats dimensions as cubes and prefix the...
-
Speaking at TechEd 2009 USA
March 2, 2009 / No Comments »
One of my TechEd 2009 session proposals got approved. The session is tentatively named Reporting Services 2008 Tips and Tricks, How-to, and Beyond. I am planning to cover solutions to common questions and challenges that span the three phases of the reporting lifecycle: authoring, management and delivery. I hope you can attend my session If you planning to attend TechEd 2009 USA. Shoot me a note if you want me to cover something in particular. See you in LA!
-
Hacking MDX Query Designer Parameters
February 26, 2009 / 2 Comments »
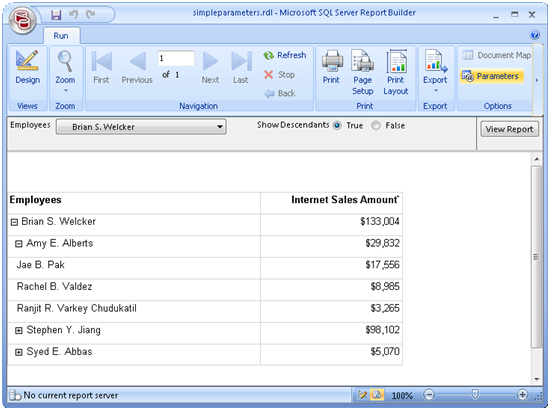
[View:/CS/cfs-file.ashx/__key/CommunityServer.Blogs.Components.WeblogFiles/blog/simpleparameters.zip]Continuing our intrepid journey in the land of SSRS-SSAS integration, after we've figured out how to retrieve the cube metadata, we are ready to tackle another unchartered territory: query parameters. Issue: You need to parameterize the MDX query by a measure or a simple parameter. Take for example the following report (attached). This report shows the Internet Sales Amount measure broken down by the Employees parent-child hierarchy. What's more interesting is the Show Descendants parameter. It lets you filter the report for a single employee (Show Descendants = False) or the descendants of the selected employee including the selected employee (Show Descendants = True). So, what's the issue? You can whip out such a report in no time if you source data from a relational database. However, the MDX Query Designer insists that the parameter is resolved to a single dimension member or a set of dimension members. Apparently, simple...
-
Report Builder 2.0 ClickOnce
February 25, 2009 / 2 Comments »
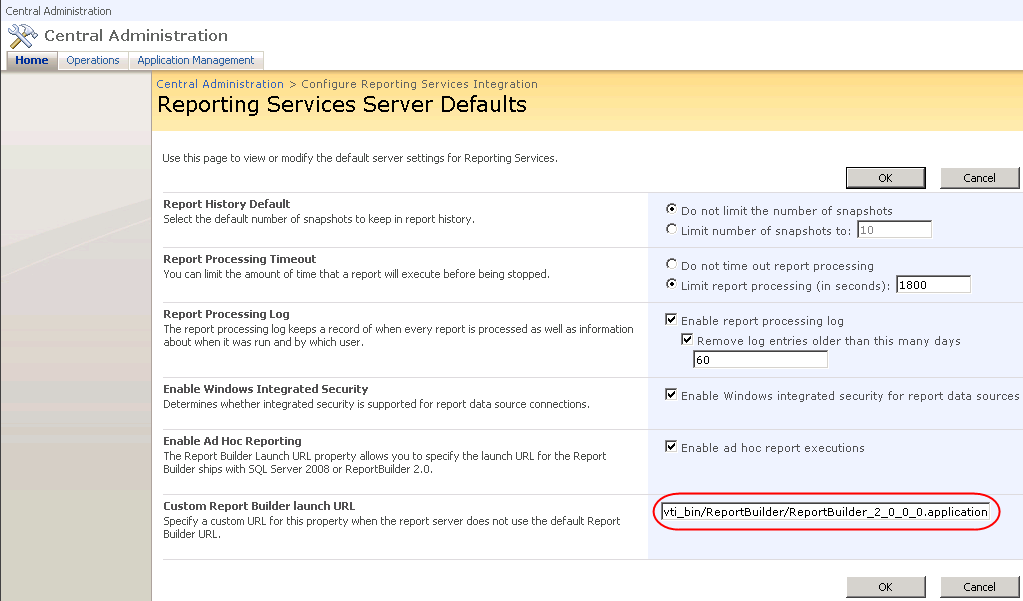
One important change that Service Pack 1 for SQL Server 2008 (public CTP available here) will bring is ClickOnce deployment of Report Builder 2.0. By default, however, Report Manager or SharePoint (if you have SSRS installed in SharePoint integration mode) still point to Report Builder 1.0. Here is how to reconfigure SSRS to launch Report Builder 2.0 instead. The following procedure assumes SharePoint integration mode but the steps are similar if SSRS is running in native mode. CAUTION Steps 1 and 2 below to copy folders are for the CTP bits of SQL Server 2008 SP1 only because the CTP build doesn't support RB 2.0 ClickOnce in SharePoint integration mode. SQL Server 2008 SP1 RTM will include an installer to make the appropriate folder changes automatically. Therefore, DO NOT manually copy the folder content with the final bits or undo your changes before you install SP1 RTM so the installer doesn't fail. SharePoint Integration Mode Only. Back...
-
Reporting Services Tracer
February 24, 2009 / No Comments »
To make a humble contribution to open source, I've just uploaded the Reporting Services Tracer (RsTracer) project to CodePlex. RsTracer helps you trace the URL and SOAP traffic to/from a report server. Given the sheer number of Web methods supported by Reporting Services, you might find yourself asking which web method should you choose for the management task at hand and how should you call it? At the same time, it is likely that Report Manager or Management Studio already supports some aspect of the management feature you want to implement. Wouldn't it be nice to be able to peek under the hood and see what APIs Report Manager or a custom application calls? This is exactly what the RsTracer sample was designed to handle. RsTracer intercepts the server calls and outputs them to a trace listener, such as the Microsoft DebugView for Windows. RsTracer helps you see the APIs...
-
Retrieving Cube Metadata in Reports
February 13, 2009 / No Comments »
An interesting question popped up on the discussion list the other day about how to retrieve a list of the cube measures so the report author can display them in a report parameter. Solution 1: If you just need a list of measures but not the measure metadata, such as display folder, etc., you can use the following (not trivial, ok hacky) query, which I borrowed from my esteemed colleague MVP and MDX guru Chris Webb: WITH SET MYSET AS HEAD([Date].[Date].[Date].MEMBERS, COUNT(MEASURES.ALLMEMBERS)-1) MEMBER MEASURES.MeasureUniqueName AS MEASURES.ALLMEMBERS.ITEM(RANK([Date].[Date].CURRENTMEMBER, MYSET)-1).UNIQUENAME MEMBER MEASURES.MeasureDisplayName AS MEASURES.ALLMEMBERS.ITEM(RANK([Date].[Date].CURRENTMEMBER, MYSET)-1).NAME SELECT {MEASURES.MeasureUniqueName, MEASURES.MeasureDisplayName} ON 0, MYSET ON 1 FROM [Adventure Works] Solution 2: This approach is especially useful if you need the measure properties. In this case, you must use the OLE DB Provider for Analysis Services instead of the SSRS Analysis Services Provider (the one that gives you the nice MDX Designer). This approach uses the...
-
Named Set Subtotals in Excel
January 27, 2009 / No Comments »
So many SSAS browsers, so little resemblance... And each browser has an independent view of which SSAS features it cares about and how it will go about implementing them. For example, Excel 2007 will let you use named sets on rows or columns but not as a filter. The cube browser and Report Builder let you use them in the filter area but not on columns and rows. Issue: Business users have requested a subtotal for named set in Excel 2007. Say, you've defined the following named set in the cube to return the last 12 months from the current month. CREATE DYNAMIC SET CURRENTCUBE.[Last 12 Months] AS [Date].[Date Hierarchy].CurrentMember.Lag(11):[Date].[Date Hierarchy].CurrentMember If you drop this named set on an Excel 2007 PivotTable report, you would notice that it doesn't give you a subtotal that returns the aggregated total of the measure used in conjunction with the set. However, the...
-
Business Intelligence is Fifth Hottest IT Skill
January 15, 2009 / No Comments »
ComputerWorld ranks BI as the fifth hottest IT skill.
-
Implementing Cube Settings
January 14, 2009 / No Comments »
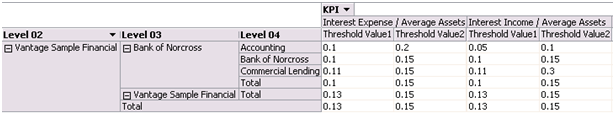
I had to tackle an interesting requirement the other day. A cube had a number of KPIs defined but the threshold values that were used to define the "good", "bad", and "so-so" status ranges had to be defined as configurable values at any level of the organization dimension and KPIs. I settled on implementing a measure group that intersects the organization dimension and a new KPI dimension that lists the KPI names. For example, as the screenshot shows, each KPI has two threshold values (Threshold Value1 and Threshold Value2) which can be defined at any level of the organization hierarchy. Note that the parent values read the setting values directly from the fact table instead of being derived by rolling up from the children. The first implementation approach that comes to mind is to use the None AggregateFunction function for the measure group so you read the measure values associated...
-
Reporting Services 2008 Dashboard Goes Live
January 5, 2009 / No Comments »
Thanks to the Robert Bruckner's blog, I've learned that Microsoft has published the Reporting Services 2008 Information Aggregator. It is a cool dashboard page that aggregates a variety of resources related to Reporting Services, such as training content, white papers, blogs and more. I'm proud to be featured as an MVP J The page also includes to my most recent books and training videos I've authored. Kudos go to the Reporting Services user education team who worked hard to implement this page. Check out the SSRS aggregator and add it to your favorites.
Training
 We offer onsite and online Business Intelligence classes! Contact us about in-person training for groups of five or more students.
For more information or to register click here!
Books
 Learn Power BI at your own pace with our latest book Applied Microsoft Power BI. Targeting information workers, data analysts, pros, and developers, It is designed as an easy-to-follow guide for learning how to implement BI solutions spanning the entire personal-team-organizational BI spectrum.

