-
How Do We Start?
September 27, 2017 / No Comments »

How do you start a data warehousing project? Not much different than any complex software project. You break it down to small iterations, e.g. by subject area, design and implement each iteration from beginning to end, and deploy to deliver incremental value. Agile? Perhaps. In my career I've seen software methodologies come and go so I'd abstain from applying a label. The main goal is to break complex tasks in smaller increments. You can call it agile if you want. But if I must meet every day for 15 minutes and hold hands (I had to do this a while back because my employer was agile, believe me), or deliver some crappy code in some predefined timeframes (sprints), then agile I am not. So you stated your first iteration (typically Sales as revenue is an important metric to track). Now what? Next, we identify metrics, aka measures. Should you reverse...
-
Atlanta MS BI Group Meeting on September 25th
September 24, 2017 / No Comments »

MS BI fans, join me for the next Atlanta MS BI and Power BI Group meeting on September 25th at 6:30 PM. Carlos Rodriquez and Daniel Granadillo from Brightstar will share their experience with Power BI and QlikView. Accelebrate will sponsor the meeting. And your humble correspondent will show you two new cool Power BI features: drillthrough to page and explain increase/decrease. Presentation: Did Qlik run out of BI Power? Level: Intermediate Date: September 25, 2017 Time 6:30 – 8:30 PM ET Place: South Terraces Building (Auditorium Room) 115 Perimeter Center Place Atlanta, GA 30346 Overview: Haters are gonna hate. Lovers are gonna love. What about you? Come decide by yourself whether you are a Qlik or a PBI guy/gal. This presentation is intended for anyone who wants to see these two BI tools in action. Carlos and Daniel will show the differences and similarities between QlikView and Power BI. They will perform...
-
Power BI Group Security
September 20, 2017 / No Comments »
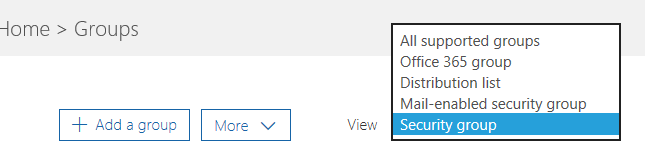
Power BI security is interwoven with Azure and O365 security. Sure, granting individual users access by entering emails works everywhere but it quickly becomes counterproductive with many users. For example, a large insurance company would like grant report access to 250 users and integrate this report with Dynamics 365. If you secure individually, this will require entering 250 emails three times: Dynamics 365, Power BI, and Row-level Security (RLS). As in the old days, we want to use groups to reduce the maintenance effort because all these users are added to a security group, we can just grant access to the group. And, when users come and leave, we make changes to one place only: the group and everything will work magically. However, nothing is simple and security is no exception. In fact, Office 365 has various group types, as you can see below. To make things even more interesting,...
-
Quick Insights Coming to PBI Desktop
September 14, 2017 / No Comments »
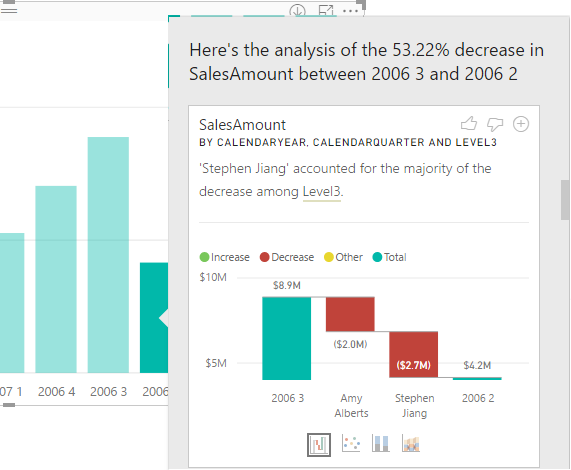
The September release of Power BI Desktop brings Quick Insights in the form of the very nice Explain Increase/Decrease feature (in preview). Suppose you have a column chart and you see a sudden increase or decrease in the chart series. You can now right-click on the bar and then click Analyze, Explain the Decrease menu. This runs the Quick Insights machine learning algorithms to predict what caused the anomaly. As in Power BI Service, Quick Insights produces several reports. In this case, one of the Quick Insights visuals informs me that most of the decrease is contributed to the bad performance of one of the sales reps (Stephen Jiang). I could have sliced and diced all day long but I could have found this myself. If I find a particular Quick Insight visual useful, I can add it to the report. From that point, I can use just like any...
-
Power BI Page Drillthrough
September 11, 2017 / No Comments »
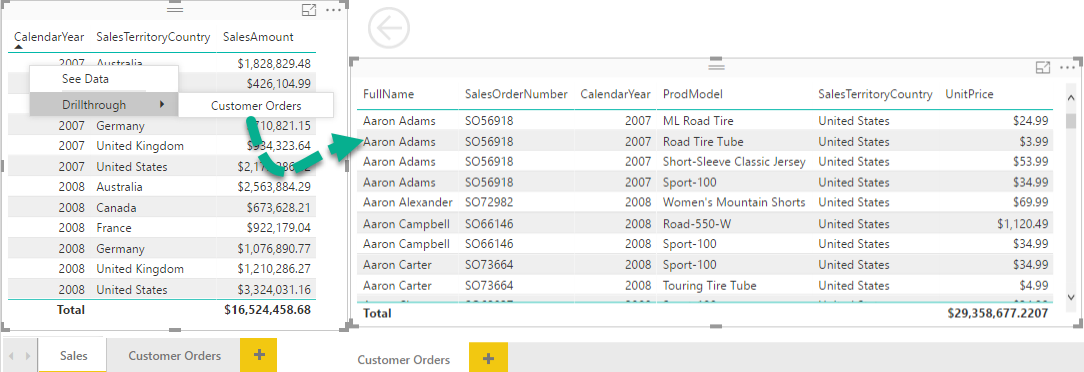
The September release of Power BI Desktop adds two very useful features: drilling through another page and explain increase/decrease. SSRS practitioners might find "page drillthrough" similar to SSRS actions. However, instead of navigating to another report, it allows the user to navigate to another page within the same report (at least for now cross-report drillthrough is not supported). Although not as flexible as SSRS actions, PBI page drillthrough expands the Power BI data exploration capabilities. Previously, you had the following drillthrough options: Dashboard drillthrough – Clicking on a dashboard tile navigates you to the underlying report assuming the tile was produced by pinning a report visual. See records – This chart-level features allows you to right click a bar and see the data behind it. I won't repeat the Microsoft intro (watch it here) but I'll add a few more notes that the demo doesn't cover and I find very...
-
Deploying and Processing Azure AS
September 11, 2017 / No Comments »
In the "Processing Tabular from Exotic Clients" blog, I said that if you Azure AS model retrieves data from an Azure database, such as Azure SQL Database, it should also be located in the same Azure data center for faster processing and to avoid data transfer fees between data centers. Let's elaborate a bit on this and share some performance results from a real-life project. We deployed two Azure AS instances to North Central and South Central Azure data centers, while the Azure SQL Database was deployed to the South Central data center. Here the stats for processing loading about 35 million rows in Tabular using the Full Process of the AS database. The Azure SQL Database was at P1 performance level and Azure AS was at S1 performance level. South Central: 12 minutes or about 50,000 rows/sec North Central: 19 minutes or about 30,000 rows/sec As you can see,...
-
Power BI vs Qlik Presentation
September 7, 2017 / 6 Comments »

Mark your calendar for the next meeting of our Atlanta MS and Power BI Group on September 25th when we will compare Power BI and Qlik. Presentation: Did Qlik run out of BI Power? Level: Intermediate Date: September 25, 2017 Time 6:30 – 8:30 PM ET Place: South Terraces Building (Auditorium Room) 115 Perimeter Center Place Atlanta, GA 30346 Overview: Haters are gonna hate. Lovers are gonna love. What about you? Come decide by yourself whether you are a Qlik or a PBI guy/gal. This presentation is intended for anyone who wants to see these two BI tools in action. Carlos and Daniel will show the differences and similarities between QlikView and Power BI. They will perform side-by-side the following: Extract and transform data Create a data model (so to allow cross filtering) Compare features side by side, including hiding/displaying visuals, creating linked objects, role-playing dimensions, what-if scenarios Create a nice...
-
Processing Tabular from Exotic Clients
September 7, 2017 / No Comments »
Processing Tabular models from SSMS or .NET client apps is pretty straightforward. For example, you can connect with SSMS and issue processing commands through the UI or via TMSL. You can also use custom apps with Tabular Object Model (TOM) and you can send XMLA commands directly if you have an app perhaps that's already doing that. For Azure AS, it's generally a good idea to run the app sending the processing command in the same data center where the Azure AS server is. If your Tabular database gets data from an Azure database, such as Azure SQL Database, the database should also be located in the same data center for better processing throughput and to avoid data transfer fees between data centers. But what if you want to issue a processing command from more exotic clients, such as Python? Or, incrementally process from SSIS? Start with creating a JSON...
-
Power BI What-if Analysis
August 28, 2017 / No Comments »
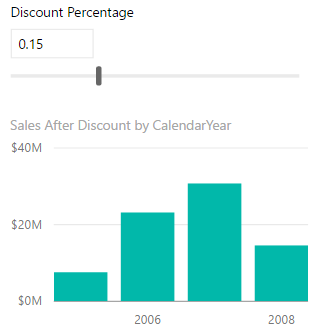
Veteran Excel users might have used the Excel What-if feature that let you try several different sets of values in one or more formulas to explore various outcomes (scenarios). The August release of Power BI Desktop introduces a similar feature. You start by defining a What If parameter from the Modeling tab. Don't confuse the What If parameter with a query parameter which is used in query parameter-driven properties, such as to change the data source the query connects to. In the process of configuring the parameter, you define hardcoded minimum, maximum, and increment values. The outcome is two DAX measures. The first one generates the scale, while the second returns the selected value. Discount Percentage = GENERATESERIES(0, 0.5, 0.05) Discount Percentage Value = SELECTEDVALUE('Discount Percentage'[Discount Percentage]) Next, you can use the "Value" measure as any DAX measure. Typically, you would create a target measure that somehow depends on...
-
Power BI vs. Pyramid
August 16, 2017 / No Comments »
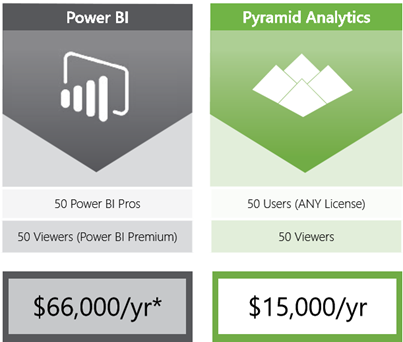
I've never thought I'd see this one coming but today I got a marketing email from Pyramid Analytics (previously an ardent Microsoft partner) citing a head-to-head comparison with Power BI. Et tu, Brute? "Let’s start with a clear pricing model – one that doesn’t require an online calculator to figure out annual costs. Let’s add in fundamental capabilities and features like dashboarding, KPI’s, dicing, time intelligence, parameterization, and asymmetric reporting. Let’s close out with a complete lack of narrative reporting capabilities. The Pyramid Analytics platform provides an enterprise class on-premises BI solution that delivers all of the above plus simple advanced analytics. It’s available now and at a price you can easily understand. There's a clear choice. Click here for a head-to-head comparison and a limited time offer" I pity any vendor that competes with Power BI, especially the ones that compete "head-to-head". Pyramid must feel the heat to come...
Training
 We offer onsite and online Business Intelligence classes! Contact us about in-person training for groups of five or more students.
For more information or to register click here!
Books
 Learn Power BI at your own pace with our latest book Applied Microsoft Power BI. Targeting information workers, data analysts, pros, and developers, It is designed as an easy-to-follow guide for learning how to implement BI solutions spanning the entire personal-team-organizational BI spectrum.

