-
5 Tools for Understanding BISM Storage
April 14, 2014 / No Comments »

Recall that the Microsoft BI Semantic Model consists of three flavors: Multidimensional, Tabular, and Power Pivot. The default storage mode of Tabular and Power Pivot is the xVelocity in-memory engine. The default Multidimensional storage is MOLAP. You might want to analyze which objects consume the most storage space. This especially important for Tabular since computer memory is still a scarce resource. Windows Explorer The easiest way to get the storage breakdown for Multidimensional and Tabular is to use Windows Explorer and examine the size of the corresponding data folder under the SSAS Data folder, e.g. C:\Program Files\Microsoft SQL Server\MSAS11.TABULAR\OLAP\Data\AdventureWorks Tabular Model SQL 2012.0.db. Unfortunately, Windows Explorer in Windows 7 and 8 doesn't show the folder size requiring you either to hover on the folder to see its size or to go the folder properties. As a workaround, consider utilities such as HDGraph or Folder Size. Folder Size, for example, pops...
-
Where is Your Focus?
April 6, 2014 / No Comments »
With all the tremendous interest around BI, new vendors and tools are emerging almost every day. In general, you can approach your BI needs in two ways. You can try a top-down approach starting with the presentation layer, hoping that a cool data visualization tool and self-service BI will somehow solve your challenges. Lots of vendors out there would love to take you on that path. You can follow a bottom-up approach that starts with a solid data foundation and semantic layer that enables a single version of the truth and it is supported by most popular visualization tools. I had the pleasure to teach a class this week for the HR department of one of the largest and most successful companies. They have an ambitious goal to establish a modern data analytics platform in order to gain insights into all aspects of their workforce. Their manager told that they...
-
Data Models for Self-Service BI
March 30, 2014 / No Comments »
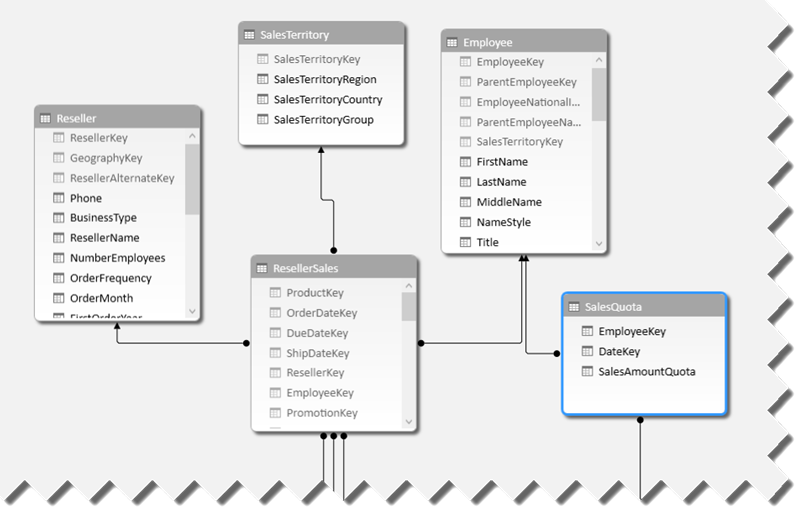
The self-service BI journey starts with the business user importing data. With Microsoft Power Pivot, we encourage the user to import tables and create relationships among these tables, similar to what they would do with Microsoft Access. This brings tremendous flexibility because it allows the user to incrementally add new datasets and implement sophisticated models for consolidated reporting, such as for analyzing reseller and internet sales side by side. True, Power Pivot relationships have limitations, including: The lookup table must have a primary key and the relationship must be established using this key. As it stands, Power Pivot doesn't support multi-grain relationship where the fact table joins the lookup table at a higher grain than the primary key. Many-to-many relationships (such as a joint bank account) are not natively supported and currently require simple DAX formulas to resolve the relationship, such as CALCULATE ( SUM ( Table[Column] ), BridgeTable) Closed...
-
Building a Custom ETL Framework with SSIS 2012
March 24, 2014 / No Comments »
Even though the SSIS catalog and the new project deployment mode in SQL Server 2012 take care of many of the mundane monitoring needs, a custom ETL framework is still important for handling features such as restartability and parallelism. Join our next Atlanta BI User Group meeting on Monday, March 31st when Aneel Ismaily will talk about this subject in his "Building a Custom ETL Framework with SSIS 2012" presentation. "ETL Frameworks are the foundation of any data warehouse/data mart implementation. In this session we will discuss building a heavy-duty enterprise ETL Framework and will talk in detail about some major ETL enhancements available in SQL Server 2012. Topics include auditing, logging, designing for fault tolerance and recoverability, handling orchestration, parallelism and finally scheduling." X-IO will sponsor the meeting and present their Intelligent Storage Element fast storage product.
-
Dynamic Dimensions
March 23, 2014 / No Comments »
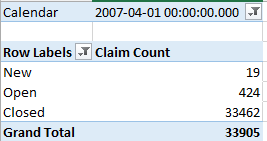
Scenario You need to assign a dimension dynamically to a cube measure group, such as to calculate binning. In the extreme example, you might need to perform fact row level evaluation to determine where the dimension "fits" in. Consider the following example from the insurance industry. An ODS-style Claim table interprets every change to the claim table as a Type 2 change by creating a new row and expiring the previous row of the claim. Claim_Key Start_Date End_Date Claim_Number Status 1 1/1/2010 5/1/2010 C00001 New 2 5/2/2010 3/8/2012 C00001 Open 3 3/9/2012 12/31/9999 C00001 Closed Options Given this scenario, you might want to count the number of claims as of any date. You have two options: Create a Claim Snapshot fact table taken at a daily or monthly interval. Dynamically associate the Date dimension. In Multidimensional, this will require creating a Claim dimension and a Claim measure group, both...
-
KPIs on Smartphone
March 2, 2014 / No Comments »
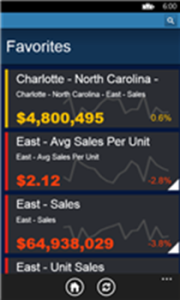
Some of your might be familiar with the PushBI mobile BI offering of Extended Results. The company was recently acquired by Tibco. Now rebranded as Tibco Spotfire Metrics, its mobile BI offering is now available for the most popular mobile platforms, including Windows Phone and Windows 8. As its documentation explains, Spotfire Metrics supports surfacing KPIs from a variety of data sources, including Analysis Services. If you're looking for ways to present KPIs to mobile phones, Spotfire Metrics could fill in the gap.
-
Analyzing Power Pivot Models with Tableau
February 24, 2014 / No Comments »
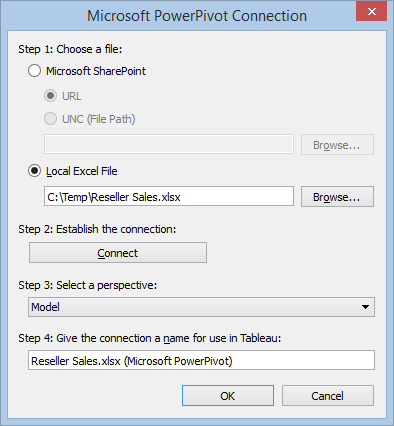
Now that Tableau has been highly praised by Gartner, you might be looking for ways to make the best of both self-service BI tools: the great data modelling capabilities and programming richness of Power Pivot and the visualization strengths of Tableau. Interestingly, besides published to SharePoint Power Pivot workbooks, Tableau can connect to local Power Pivot models and send MDX queries (as it does when connected to Multidimensional and Tabular). This works thanks to the Tableau PowerPivot Connector wrapper (Microsoft SQL Server 2012 PowerPivot for Excel) that you can install from the Tableau website. Read this document to decide which one to use.
-
2014 BI Outlook: Who’s Hot, Who’s Not
February 24, 2014 / No Comments »
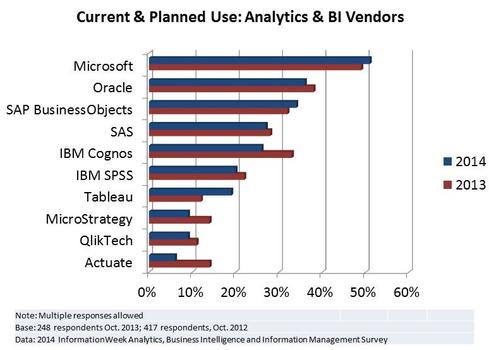
While Microsoft has fallen a bit in the Gartner's eye, according to InformationWeek, it's the hottest BI vendor in 2014. I guess the reason is that Gartner focuses predominantly on visualization, which is just one of the BI manifestations, while InformationWeek looks at the entire BI ecosystem.
-
Gartner’s Magic Quadrant for Business Intelligence and Analytics Platforms 2014 Released
February 24, 2014 / No Comments »
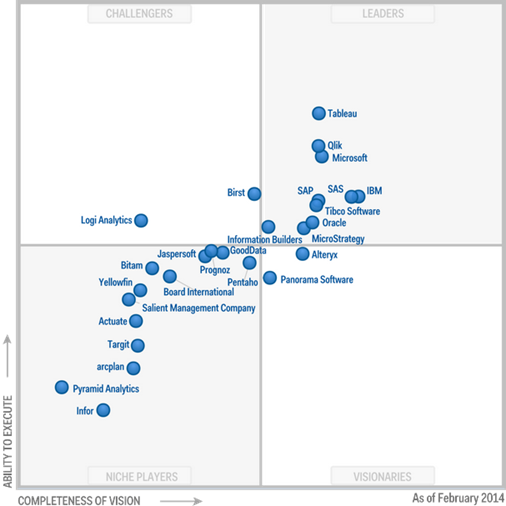
Gartner released the 2014 update of the Business Intelligence and Analytics Platforms Magic Quadrant. Interestingly, Gartner moved the predictive capabilities to a new Magic Quadrant for Advanced Analytics Platforms and dropped scorecards. The most interesting aspect of this report for me was the Market Overview section at the end. According to Gartner, the most prevalent future BI trends will be: 7% BI annual growth all the way until 2017 Visual data discovery Easier data preparation Collaboration and social analysis Growth in Cloud BI Real-time BI Deemphasizing the BIG DATA hype Join me at the Atlanta MS BI Group meeting tonight to discuss item 5 and at SQL Saturday in Atlanta on May 3rd to talk about item 6.
-
Atlanta MS BI Group Meeting on February 24th
February 21, 2014 / No Comments »
Atlanta BI fans, Join us for the next Atlanta MS BI Group meeting on Monday, February 24th. Lance England will present "introduction to MDX". Computer Associates will sponsor our meeting and show us the latest Erwin release. I'll also talk briefly and present Power BI now that it went live. Spread the word and invite your coworkers but RSVP on our website so we can plan food accordingly. Also, don't forget to register for the SQL Saturday precons that will take place on May 2nd, the day before SQL Saturday Atlanta. Main Presentation: MDX Fundamentals Level: Intermediate Date: Monday, February 24th, 2014 Time 6:30 – 8:30 PM ET Place: South Terraces Building (Auditorium Room) 115 Perimeter Center Place Atlanta, GA 30346 Overview: MDX is a powerful language, but the price of that power is a higher degree of complexity. The key to understanding MDX is to learn the fundamental...

 We offer onsite and online Business Intelligence classes! Contact us about in-person training for groups of five or more students.


