-
Gartner’s 2013 Data Warehouse Magic Quadrant
February 5, 2013 / No Comments »
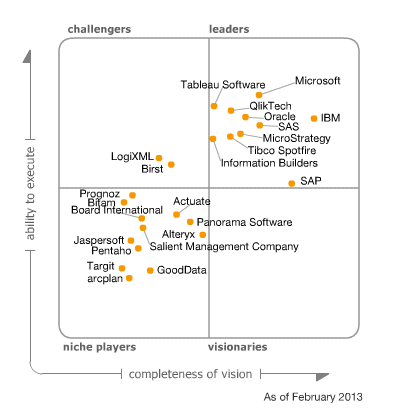
MVP fellow, Andrew Burst, discusses Gartner's newly released DW (not BI, mind you) magic quadrant. It looks like Gartner fell in love with Teradata but Microsoft is moving up as well thanks to the advances in its Parallel Data Warehouse (PDW) and in-memory offerings.
-
Performance Degradation with the Aggregate Function and Unrelated Dimensions
February 5, 2013 / No Comments »
I ran into a severe performance issue with the Aggregate function and unrelated dimensions which I reported on connect. In this context, an unrelated dimension is a dimension that doesn't join any measure group in the cube. Why have unrelated dimensions? My preferred way to implement time calculations is use a regular dimension that is added to the cube but not related to any measure groups. Then, I use scope assignments to overwrite the time calculations, e.g. for YTD, MTD, etc. For example, the scope assignment for YTD might look like: Scope ( [Relative Date].[YTD] ); this = Aggregate ( {[Relative Date].[Current Period]} * PeriodsToDate([Date].[Fiscal].[Fiscal Year], [Date].[Fiscal].CurrentMember) ); End Scope; Notice the use of the Aggregate function which when executed maps to the default aggregation function of the underlying measure. For some reason with SQL Server 2012, a query that uses the Relative Date dimension experiences a significant performance hit....
-
PowerPivot Data Refresh in Excel 2013
February 4, 2013 / No Comments »
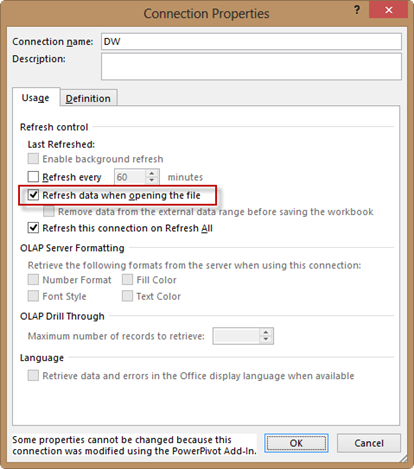
What options does a PowerPivot user have to refresh data in a PowerPivot model on the desktop, aka PowerPivot for Excel? Prior to Excel 2013, the answer was just one – manual refresh by either clicking the Refresh button in the PowerPivot window or the Refresh button in the Existing Connections dialog box. Note that the Refresh button in the Excel ribbon doesn't work since Excel doesn't know anything about PowerPivot. Not does the checking the "Refresh data when opening the file" checkbox in the PowerPivot connection. In Excel 2010, these options won't reopen the PowerPivot connections to the data sources. Instead, the net effect is that they will simply refresh the pivot reports from the pivot cache which is not what you're after. Starting with Excel 2013, however, Excel and PowerPivot play better together as I discussed in my What's New in Office 2013 BI blog. And, now we...
-
PerformancePoint 2013 Dependencies for Analysis Services
February 4, 2013 / No Comments »
Besides the usual hassle configuring PerformancePoint, including insufficient permissions to databases and service accounts, version 2013 requires the SQL Server 2008 R2 drivers. This is surprising considering that SharePoint 2013 shipped after SQL Server 2012. In a previous blog, I explained how to configure the SharePoint 2013 BI Center. When you go to any of the PerformancePoint-related links, such as Dashboards or PerformancePoint Content, you'll see the following ribbon. The Dashboard Designer button is the new way to launch the PerformancePoint Designer. However, when you attempt to configure a data source pointing to Analysis Services, you will likely get an error. The first stop for troubleshooting SharePoint and PerformancePoint issues is of course the Windows Event Log. If you examine the Windows Event Log, you'll see that PerformancePoint fails to load the 10.0 version of Microsoft.AnalysisServices.AdomdClient. This is the version that's included in SQL Server 2008 R2. This sends you...
-
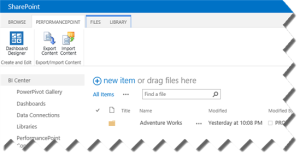
The SharePoint 2013 Business Intelligence Center
February 4, 2013 / No Comments »
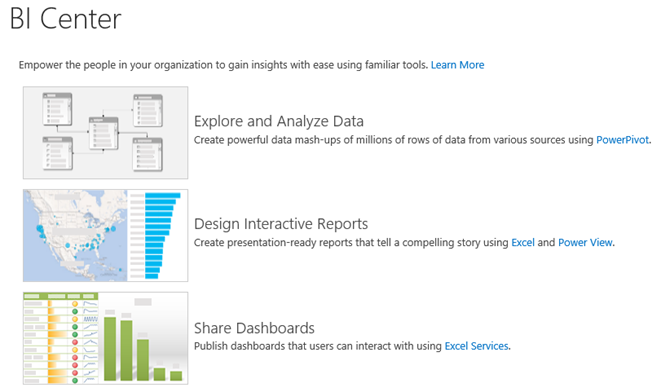
Where should I put my BI reports? Should I upload them to department-level SharePoint sites or put them in one place? These are common questions that we get from customers. Delivering on the promise of pervasive BI, my preference is to centralize BI artifacts in a single place. Ideally, this BI depository should be the SharePoint Business Intelligence Center. If organizational security is required, you can control security at SharePoint site or library level. For example, you can create department-specific PowerPivot galleries. The BI Center is one of the SharePoint site templates that is specifically designed to host BI reports. In SharePoint 2013, Microsoft has extended the BI Center to accommodate various types of BI documents. When I first installed the BI Center in SharePoint 2013 (click Settings (the wheel in the top-right corner), Site Contents, New Subsite, Enterprise Tab, Business Intelligence Center), I was confused. The images are not...
-
Programming MapReduce Jobs with HDInsight Server for Windows
December 28, 2012 / 4 Comments »
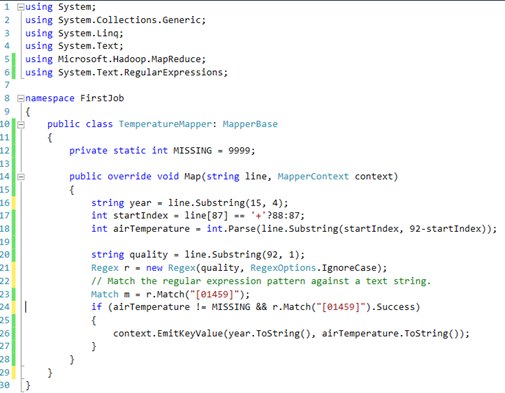
In a previous blog "Installing HDInsight Server for Windows", I introduced you to the Microsoft HDInsight Server for Windows. Recall that HDInsight Server for Windows is a Windows-based Hadoop distribution that offers two main benefits for Big Data customers: An officially supported Hadoop distribution on Windows server – Previously, you can set up Hadoop on Windows as an unsupported installation (via Cygwin) for development purposes. What this means for you is that you can now set up a Hadoop cluster on servers running Windows Server OS. Extends the reach of the Hadoop ecosystem to .NET developers by allowing them to write MapReduce jobs in .NET code, such as C#. And, in previous blogs, I've introduced you to Hadoop. Recall that there are two main reasons for using Hadoop for storing and processing Big Data: Storage – You can store massive files in a distributed and fault-tolerant file system (HDFS) without...
-
Happy Holidays!
December 26, 2012 / No Comments »
As another year is winding down, it's time to review and plan ahead. 2012 was a great year for both Prologika and BI. On the business side of things, we achieved Microsoft Gold BI and Silver Data Platform competencies. We added new customers and consultants. We completed several important projects with Microsoft acknowledging two of them. 2012 was an eventful year for Microsoft BI. SQL Server 2012 was released in March. It added important BI enhancements, including Power View, PowerPivot v2, Reporting Services End-User Alerting, Analysis Services in Tabular mode, Data Quality Services, Integration Services enhancements, MDS Add-In for Excel, Reporting in the Cloud, and self-service BI for Big Data with the Excel Hive add-in. The next BI wave came with Office 2013 and added important organizational and self-service BI features, including PowerPivot Integration in Excel 2013, Power View Integration in Excel 2013, Excel updatable web reports in SharePoint, productivity...
-
DAXMD Goes Public!
November 30, 2012 / No Comments »
Microsoft announced yesterday the availability of the Community Technology Preview (CTP) of Microsoft SQL Server 2012 With Power View for Multidimensional Models (aka DAXMD). As a participant of the CTP program and I'm very excited about this enhancement. Now customers can leverage their investment in OLAP and empower business users to author Power View ad-hoc reports and dashboards from Analysis Services cubes. Previously, Power View supported only PowerPivot workbooks or Analysis Services Tabular models as data sources. I'm not going to repeat what T.K. Anand said in the announcement. Instead, I want to emphasize a few key points: This CTP applies only to the SharePoint-version of Power View. Excel 2013 customers need to wait for another release vehicle to be able to connect Power View in Excel 2013 to cubes. You'll need to upgrade both the SharePoint server and SSAS server because enhancements were made in both Power View and...
-
Atlanta BI Group Meeting on Monday, December 3rd
November 29, 2012 / No Comments »
I'll be presenting What's New in Excel 2013 and SharePoint 2013 BI at our Atlanta BI Group on Monday, December 3rd. Microsoft has recently released the 2013 version of Excel and SharePoint. Both technologies include major enhancements for self-service and organizational BI. Join us to review these new features. Learn how business users can quickly analyze and understand data in Power Pivot which is now natively supported by Excel. See how Power View enables rich data visualization and having fun with data both on the desktop and server. Understand the new Excel and SharePoint features for organizational BI that opens new opportunities for analyzing OLAP and Tabular models.
-
Geocoding with Power View Maps
November 29, 2012 / No Comments »

As I wrote before, Power View in Excel 2013 and SharePoint with SQL Server 2012 SP1 supports mapping. The map region supports geocoding and it allows you to plot addresses, countries, states, etc, or pairs of latitude-longitude coordinates. The key for getting this to work is to mark the columns with appropriate categories. Using latitude-longitude If you have a SQL Server table with a Geography data type, you can extract the latitude and longitude as separate columns. SELECT SpatialLocation.Lat, SpatialLocation.Long FROM Person.Address Once you import the dataset in PowerPivot, make sure to categorize the columns using the Advanced tab. The map region doesn't support grouping on latitude-longitude so you can't just place them in the Latitude-Longitude zones and expect it work. Instead, you have to add another field, such as address or both the Latitude-Longitude combination to the Location field. The map groups on the Location zone but uses the...
Training
 We offer onsite and online Business Intelligence classes! Contact us about in-person training for groups of five or more students.
For more information or to register click here!
Books
 Learn Power BI at your own pace with our latest book Applied Microsoft Power BI. Targeting information workers, data analysts, pros, and developers, It is designed as an easy-to-follow guide for learning how to implement BI solutions spanning the entire personal-team-organizational BI spectrum.

