-
Query Options for Analytical Models and Transactional Reporting
March 24, 2013 / No Comments »
Requesting both historical and transactional reports is a very common requirement. As they stand, neither Multidimensional nor Tabular are designed to support well transactional (detail-level) reporting with large datasets, as I discussed in my Transactional Reporting with Tabular blog post. There are two query options that might provide some relief with transactional reporting and they both have limitations. DRILLTHROUGH QUERIES You can use a DRILLTHROUGH query to request data at the lowest level. The syntax differs somewhat between Multidimensional and Tabular. Here is a sample drillthrough query to Adventure Works cube: DRILLTHROUGH MAXROWS 1000 SELECT FROM [Adventure Works] WHERE ([Measures].[Reseller Sales Amount],[Product].[Category].[Accessories],[Date].[Calendar Year].&[2006]) RETURN [$Product].[Product], [$Date].[Date], [Reseller Sales].[Reseller Sales Amount], [Reseller Sales].[Reseller Tax Amount] And a similar query to Adventure Works Tabular: DRILLTHROUGH MAXROWS 1000 SELECT FROM [Model] WHERE ([Measures].[Reseller Total Sales],[Product].[Category].[Category].&[Accessories],[Date].[Calendar].[Year].&[2005]) RETURN [$Product].[Product Name], [$Date].[Date], [$Reseller Sales].[Sales Amount], [$Reseller Sales].[Tax Amount] Notice that the WHERE clause specifies the coordinate...
-
Transactional Reporting with Tabular
March 18, 2013 / No Comments »
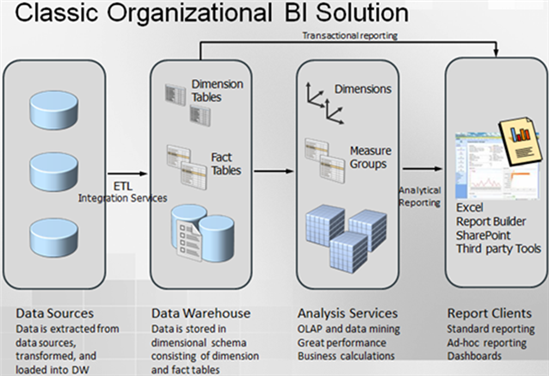
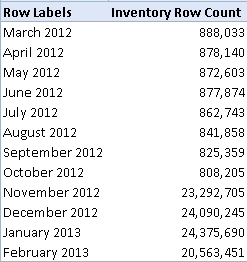
Scenario: We had a requirement to replace the existing implementation of transactional reporting over large data volumes. By "transactional reporting" I mean allowing the user to query individual transactions as they're stored in the fact table. In some cases, this style of reporting requires simply reading data without aggregations. This, of course is what RDBMS are designed for but in our case, requirements call for extending the reporting model with metadata about the item, such as the item barcode, alias, etc., as well as supporting fast aggregation analysis (for trend reports) and data security. In general, when implementing BI solutions, you should always have an analytical layer between the database and presentation layer for the reasons I discussed in the "Why an Analytical Layer?" blog. Challenges: Because of the in-memory nature of Tabular and more relaxed schema requirements, such as no separation of dimension and fact tables and ability to...
-
Improving Tabular Design Experience
March 14, 2013 / No Comments »
When you develop an organizational Tabular model in SSDT, there is always an implicit processing phase for each action you perform, such as renaming columns, creating hierarchies, changing formatting, and so on. This "data-driven" paradigm could be both a blessing and a curse. A blessing, because you always work with data and you don't have to explicitly process the model to see the effect of the changes. And a curse, because each time you make a change the UI blocks until the change is committed and this can get old pretty soon. Note: As long as you don't use the Table Properties dialog or explicitly refresh the data, all changes are done directly in the Tabular database and Tabular doesn't re-query the data source to refresh the data. While waiting for Microsoft to make the necessary changes, here are a few tips to improve your Tabular design experience: In my...
-
When Developers and BI Collide
March 9, 2013 / No Comments »
I've been running in this situation quite often so I thought this will make a good topic for a blog. Scenario: Management has asked for some sort of a BI solution, such as a dashboard. BI hasn't happened to the organization in question yet. But they have smart developers and there is no project that they can't do. As the story goes, developers go to work and whip out some code… lots of it. Code for doing ETL, code for the database layer, and code for implementing the presentation layer, such as as a custom web application with cool third-party widgets. Everyone is happy... at least for a while. I don't have an issue with developers. In fact, I spent most of my career writing code. However, there are several pitfalls with this approach so let's mention some of them: Custom code is expensive to write and maintain – Developers...
-
Adding a Set Total
March 8, 2013 / No Comments »
Scenario: You have defined an MDX set in the cube script, such as a set that returns a few months. For the sake of simplicity, we will hardcode the months. CREATE SET CURRENTCUBE.[12Months] AS { [Date].[Month].&[201302].Lag(11):[Date].[Month].&[201302] }; As useful as the set might be, it has an issue. It doesn't return the total and users might complain about it: Solution: As a first try, you might attempt to add the [All] member to the set: CREATE SET CURRENTCUBE.[Last12Months] AS { [Date].[Month].&[201302].Lag(11):[Date].[Month].&[201302] + [Date].[Month].[All] }; You're on the right path. Now, you'll get the grand total row in Excel but it shows the unrestricted (non-visual total) total instead of the total across set members only. Instead, use the VisualTotals() function: CREATE DYNAMIC SET CURRENTCUBE.[12Months] AS { [Date].[Month].&[201302].Lag(11):[Date].[Month].&[201302] + VisualTotals ( { [Date].[Month].[All], [Date].[Month].&[201302].Lag(11):[Date].[Month].&[201302] } ) }; Here, the VisualTotals function returns the All member with the total adjusted to set...
-
Optimizing Massive SQL Joins
March 3, 2013 / No Comments »
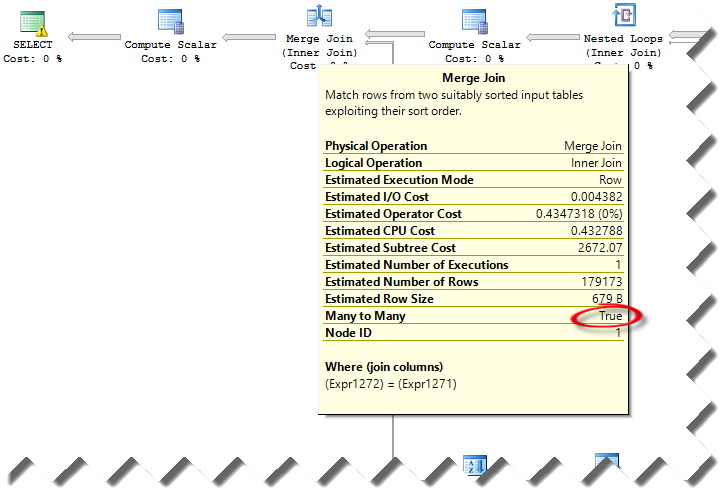
Scenario: Run ETL to perform a full data warehouse load. One of the steps requires joining four biggish tables in a stating database with 1:M logical relationships. The tables have the following counts: VOUCHER: 1,802,743 VOUCHER_LINE: 2,183,469 DISTRIB_LINE: 2,658,726 VCHR_ACCTG_LINE: 10,242,414 Observations: On the development server, the SELECT query runs for hours. However, on the UAT server it finished within a few minutes. Both servers have the same data and hardware configuration, running SQL Server 2012 SP1. Solution: Isolating the issue and coming up with a solution wasn't easy. Once we ruled out resource bottlenecks (both servers have similar configuration and similar I/O throughput), we took a look at the estimated query plan (we couldn't compare with the actual execution plan because we couldn't wait for the query to finish on the slow server). We've notice that the query plans were very different between the two servers. Specifically, the estimated...
-
CU2 for SQL Server 2012 SP1
February 27, 2013 / No Comments »
Microsoft released a while back a cumulative update 2 for SQL Server 2012 SP1. Besides other things, it includes a fix for the "wide" MDX query performance degradation issue with Analysis Services that I previously reported. Knowledge base for the performance issue Knowledge base with SP1 CU2 download link
-
Nevron Chart for Reporting Services
February 18, 2013 / No Comments »
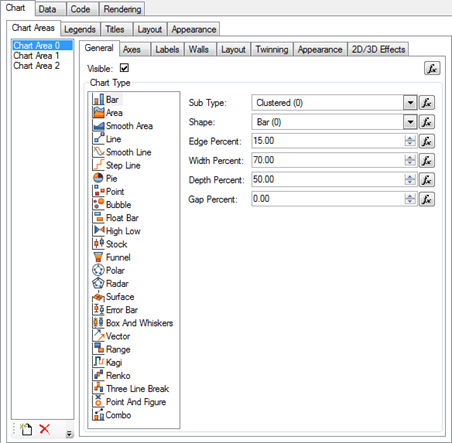
Nevron was kind enough to show me their chart and gauge for Reporting Services. In certain areas, their products exceed the charting capabilities of Reporting Services. Here are the highlights: The product provides support for SQL Server Reporting Services (SSRS) 2005, 2008, 2008R2 and SQL Server Data Tools (SSDT) 2012. Advanced Chart Designer Complete set of 2D and 3D Charting Types Support for Code Customization - Nevron Chart for Reporting Services supports customization through C# code, which allows you to use the full Nevron Chart for .NET API in SSRS and achieve a higher degree of customization. Expressions Everywhere - Nearly all properties of the Chart report item can now be specified by expressions. Appearance styles (fill, stroke, shadow and text) are also reworked to support both constant specification and specification that is based on expressions. This allows you to bind nearly all configurable aspects of the report item to...
-
SQL Server 2012 Semantic Search
February 11, 2013 / No Comments »
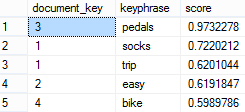
Suppose your company has a web application that allows customers to enter comments, such as to provide feedback about their product experience. How do you derive knowledge from these comments? Perhaps, customers are complaining a lot about a particular product. Or, they are raving about your service. Enter semantic search – a new feature in SQL Server 2012. Building upon full text search, semantic search allows you to search not only for words, but also for the meaning (semantics) of these works. Mark Tabladillo, Ph.D., gave us great presentation at our Atlanta BI January meeting. He demoed how semantic search can be used to find the most common phrases in a document and how to find similar documents from a given search criteria. Besides external documents, you can apply semantic search to text data already stored in a database, such as a text-based Comments field. Again, this is possible because...
-
Gartner’s 2013 Business Intelligence Magic Quadrant
February 8, 2013 / No Comments »
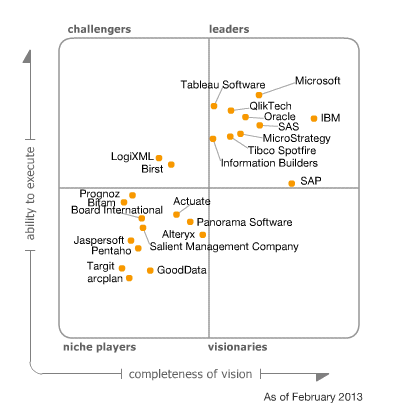
Gartner released the 2013 BI Magic quadrant report. And the winner is…
Training
 We offer onsite and online Business Intelligence classes! Contact us about in-person training for groups of five or more students.
For more information or to register click here!
Books
 Learn Power BI at your own pace with our latest book Applied Microsoft Power BI. Targeting information workers, data analysts, pros, and developers, It is designed as an easy-to-follow guide for learning how to implement BI solutions spanning the entire personal-team-organizational BI spectrum.

