-
Power View Automatic Metadata Filtering
October 19, 2011 / No Comments »
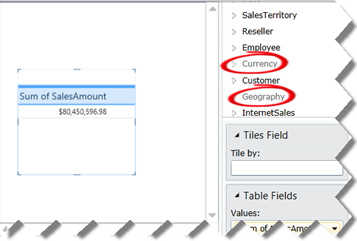
Similar to Report Builder models (now obsolete), Power View (formerly known as Crescent) filters metadata automatically. The reasoning behind this feature is that the tool should guide the user to choose only tables that are related to the ones used on the report to avoid Cartesian joins. For example, if the user has selected Sales Amount from the Reseller Sales table, Power Pivot automatically disables Currency and Geography tables because they are not related to the Reseller Sales table. The Metadata pane shows these tables greyed out and the user cannot choose a column from these tables. As useful as this feature is, it can get in the way for the same reasons the Report Builder metadata filtering didn't work so well with multidimensional cubes. Marco Russo has already reported an issue that this feature ignores M2M calculations in the model. I believe this will be even a bigger issue...
-
BISM Tabular Dynamic Data Security Over Bridge Table
September 28, 2011 / No Comments »
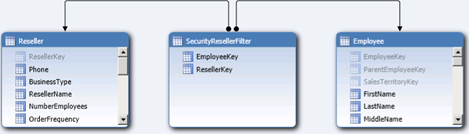
About four years ago, in my article Protect UDM with Dimension Data Security, I introduced an approach to secure dimension data in multidimensional cubes by using a factless bridge table. Since then, many BI practitioners have favored this approach because of its simplicity, reusability (transactional reports can join to the security table), and performance. Now that organizational tabular projects support data security, I wanted to try it with BISM Tabular. As it turned out, the factless bridge table approach worked out just fine. Suppose that you've build a tabular project on top of the Adventure Works DW database and the SecurityResellerFilter table is the bridge table that stores the resellers that an employee is authorized to view. As shown in the diagram, SecurityResellerFilter has two relationships SecurityResellerFilter[EmployeeKey] and Employee[EmployeeKey] and SecurityResellerFilter[ResellerKey] and Employee[ResellerKey]. You'd probably want to hide the SecurityResellerFilter table so the end users can't browse it. Given this...
-
Rendering Reports in Chrome and Safari
September 27, 2011 / No Comments »
A client complained that Reporting Services ReportViewer doesn't render reports in Google Chrome or Apple Safari browsers. The magic property to apparently fix this issue was SizeToReportContent="True" <rsweb:ReportViewer ID="reportViewer" runat="server" Height="100%" Width="100%" SizeToReportContent="True"> </rsweb:ReportViewer> Here is a link to Microsoft's official stand on the browser support for Reporting Services. A couple of notes: Currently Microsoft doesn't support report rendering in Chrome but are re-visiting the browser support matrix periodically. Report Manager doesn't work in Safari or Firefox. Report Manager supports IE only. However, report rendering by URL or ReportViewer should work with the above change.
-
Specifying a Default Report Name on Export with ReportViewer
September 27, 2011 / No Comments »
Normally, when you export a report, the Save As dialog box will default to the report name. However, if you the SSRS LoadReportDefinition API and view the report in the ReportViewer, you'll find that when you export the report it will default the name to a system generated name, such as Report(N).pdf. That's because LoadReportDefinition creates a transient report on the server that doesn't have a name. However, the ReportViewer LocalReport and ServerReport objects support a DisplayName property that can be used to specify a custom report name, such as: reportViewer.ServerReport.DisplayName = "My Report"; // the following lines are for reference only reportViewer.ProcessingMode = Microsoft.Reporting.WebForms.ProcessingMode.Remote; reportViewer.ServerReport.ReportServerUrl = new Uri(ConfigurationSettings.AppSettings[Shared.CONFIG_RS_ENDPOINT]);
-
SQL Server DENALI CTP3 Demo VHD Available
September 8, 2011 / No Comments »
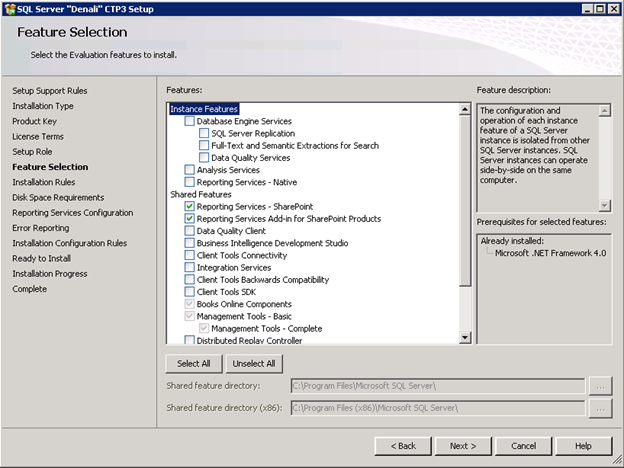
Microsoft just released a Hyper-V image of SQL Server Denali CTP3 in action, including fully configured services and integration with SharePoint 2010 and Office 2010. The following software is configured on the virtual machine: • SQL Server "Denali" CTP3 • SharePoint 2010 • Office 2010
-
CTP3 Issues with PowerPivot Management Dashboard
August 29, 2011 / No Comments »
I ran into a couple of snags with the PowerPivot Management Dashboard and CTP3 of Denali. In this case, I've installed PowerPivot for SharePoint on a standalone domain controller. The Actions web part of the PowerPivot Management Dashboard refuses to load with the following exception logged in the SharePoint URL log " Unable to acquire information about the NT group 'Enterprise Admins'" Resolution: This is a known issue that will be fixed in RTM. The workaround is to (1) delete any accounts that display their SIDs, i.e. they were part of a domain that is no longer valid, and (2) to delete any universal or enterprise groups Connect item: https://connect.microsoft.com/SQLServer/feedback/details/685945/system-exception-unable-to-acquire-information-about-the-nt-group-enterprise-admins The dashboard doesn't display any data although usage data is collected. This is caused by the fact that the PowerPivot system account doesn't have rights to the PowerPivot SQL database and the timer job fails. The SQL Profiler shows the...
-
Reporting Services "Denali" Brings Export to Excel 2007
August 20, 2011 / No Comments »
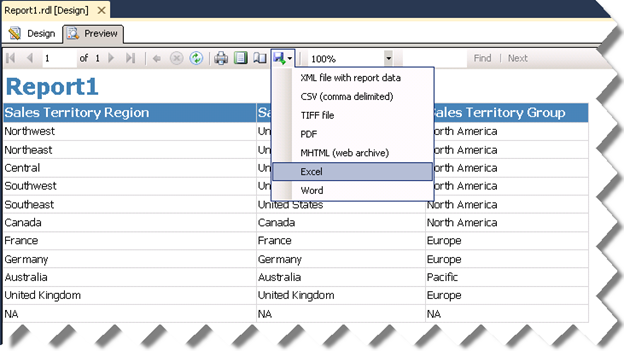
One welcome improvement in the forthcoming "Denali" release of Reporting Services is exporting to Excel 2007 (*.xlsx) file formats. I bet many companies will upgrade just to get this feature. In fact, the default rendering option when you export to Excel is to xlsx. The old Excel 2003 renderer is still there but it's hidden by default. And, yes, BI projects now integrate with Visual Studio 2010! For more details about Excel 2007 rendering, please read the Exporting to Microsoft Excel (Report Builder 3.0 and SSRS) topic in BOL.
-
Reporting Services SharePoint Integration in SQL Server Denali
August 14, 2011 / No Comments »
A week ago, I raved about how the new PowerPivot Configuration Tool would simplify configuring PowerPivot for SharePoint. Guess what? Setting up Reporting Services for SharePoint integrated mode got simplified too! In SQL Server Denali, Reporting Services leverages the SharePoint service application infrastructure and it doesn't require installing a Reporting Services server. Not only this simplifies setup but improves performance because there is no round-tripping between SharePoint and report server anymore. Configuring Reporting Services for SharePoint integration mode is a simple process that requires the following steps: Run the SQL Server Denali CTP3 setup and Install Reporting Services and the add-in on the SharePoint application server. Once the bits are installed, open SharePoint Central Administration, and click Manage Service Applications. Expand the New button and click SQL Server Reporting Services Service application. In the page that follows, configure the service application details as per your specific environment and click OK....
-
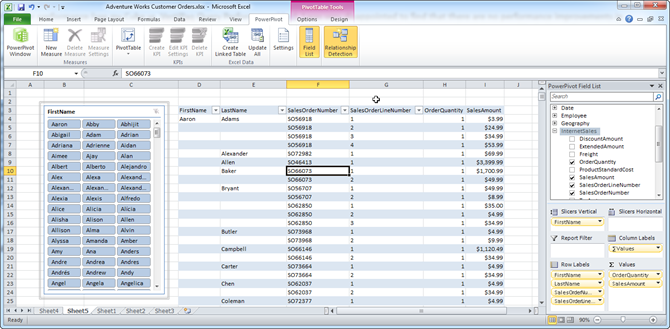
Transactional Reporting with BISM Tabular
August 8, 2011 / No Comments »
Continuing on BISM Tabular performance (see my Cube vs. VertiPaq Query Performance blog), I was disappointed to find that there are no performance improvements in PowerPivot/BISM Tabular in CTP3 in the area of detailed (transactional-level) reporting which has plagued me since the R2 release. Consider the following report build on top of an Adventure Works PowerPivot model. This report shows all Adventure Works customers and their order information by combining data from the Customer (18,000 rows) and InternetSales (60,000 rows) tables. Specifically, the report includes two columns from the Customer table and four columns from the InternetSales table. The report has a slicer to let the user filter a customer. Given that PowerPivot is an end-user tool it's likely that end users would build such reports. Unfortunately, each time you click the slicer or filter a column, the report query takes about ten minutes (!) to execute. One would surely...
-
PowerPivot Configuration Tool
August 8, 2011 / No Comments »
One great enhancement in SQL Server 11 (Denali) is the PowerPivot for SharePoint setup refactoring. Previously, the PowerPivot for SharePoint setup and configuration was included and performed at the end of the SQL Server setup. Consequently, it was very difficult to figure out what went wrong. In Denali, you need to perform the PowerPivot for SharePoint configuration as a post-installation step after the SQL Server setup completes. You can do this using the new PowerPivot Configuration Tool, SharePoint Central Administration, or PowerShell. You can find the PowerPivot Configuration Tool in the SQL Server Denali CTP3 ð Configuration Tools program group. When you open the tool, it examines the SharePoint setup and presents a list of tasks (if any) that need to be done to configure PowerPivot for SharePoint so it's operational. Once you validate the tasks and run them, the tool would perform the steps one at a time and...
Training
 We offer onsite and online Business Intelligence classes! Contact us about in-person training for groups of five or more students.
For more information or to register click here!
Books
 Learn Power BI at your own pace with our latest book Applied Microsoft Power BI. Targeting information workers, data analysts, pros, and developers, It is designed as an easy-to-follow guide for learning how to implement BI solutions spanning the entire personal-team-organizational BI spectrum.

