-
Demystifying Power BI Dataset Scale-out
February 15, 2023 / No Comments »
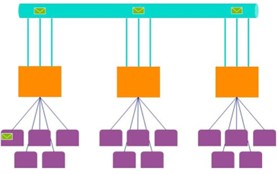
Microsoft announced a public preview of Power BI Dataset scale-out (DSO) for Power Premium, Premium per User (PPU), and Power BI Embedded. In the comments below the announcement, the article implies that this feature is a replacement for the Azure Analysis Services scale-out. "If you have an AAS scale out and you migrate your databases (aka models aka datasets aka cubes) to Power BI Premium, you get scale out automatically and at no extra cost." Scaling out for free? Sure, where do I sign? But then further down the comments, we have this clarification "[Power BI DSO happens] if a dataset is on peak load and the vcores of your capacity aren't maxed out. Keep in mind that scalability on a single instance isn't linear. By scaling out, we can achieve a better utilization of available CPU resources for high workloads. On the other hand, if your vcores are already...
-
Data Lakehouse: The Good, The Bad, and the Ugly
February 8, 2023 / No Comments »
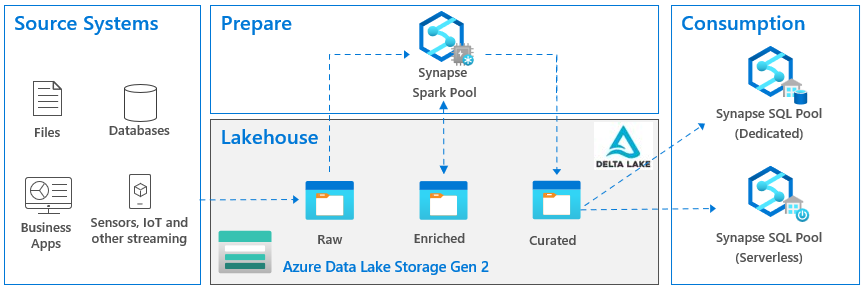
There has been a lot of noise surrounding a data lakehouse nowadays, so I felt the urge to chime in. In fact, the famous guy in cube, Patrick LeBlanc, gave a great presentation on this subject to our Atlanta Power BI Group and you can find the recording here (I have to admit we could have done better job with the recording quality, but we are still learning in the post-COVID era). What is a Lakehouse? According to Databricks which are credited with this term, a data lakehouse is "a new, open data management architecture that combines the flexibility, cost-efficiency, and scale of data lakes with the data management and ACID transactions of data warehouses, enabling business intelligence (BI) and machine learning (ML) on all data." It other words, it's a hybrid between a relational data warehouse and a data lake. Sounds great, right? Visualizing this in Microsoft parlor, the...
-
Atlanta MS BI and Power BI Group Meeting on February 6th (Lakehouse in an Hour)
January 31, 2023 / No Comments »

Please join us for the next meeting on Monday, February 6th, at 6:30 PM ET. Patrick LeBlanc (Principal Program Manager at Microsoft and Guy in a Cube) will show you how to implement a lakehouse with Delta lake, Azure Data Factory, and Synapse. For more details and sign up, visit our group page. WE ARE RESUMING IN-PERSON MEETINGS AT THE MICROSOFT OFFICE IN ALPHARETTA. WE STRONGLY ENCOURAGE YOU TO ATTEND THE EVENT IN PERSON FOR BEST EXPERIENCE. PLEASE NOTE THAT GUESTS ENTERING MICROSOFT BUILDINGS IN THE U.S. MUST PROVIDE PROOF OF VACCINATION OR SELF-ATTEST WITH HEALTHCHECK (HTTPS://AKA.MS/HEALTHCHECK). ALTERNATIVELY, YOU CAN JOIN OUR MEETINGS ONLINE VIA MS TEAMS. WHEN POSSIBLE, WE WILL RECORD THE MEETINGS AND MAKE RECORDINGS AVAILABLE AT HTTPS://BIT.LY/ATLANTABIRECS. PLEASE RSVP ONLY IF COMING TO OUR IN-PERSON MEETING. Presentation: Lakehouse in an Hour Date: February 6th Time: 6:30 – 8:30 PM ET Place: Onsite and online ONSITE Microsoft Office (Alpharetta)...
-
Implementing “Generic” Percent of Grand Total in DAX
January 26, 2023 / No Comments »

Suppose you need to calculate a percentage of grand total measure. Easy, you can use the Power BI "Show value as" without any DAX, right? Now suppose that you have 50 Table visuals and each of them require the same measure to be shown as a percentage of total. Although it requires far more clicks, "Show value as" is still not so bad for avoiding the DAX rabbit hole. But what about if you need this calculation in another measure, such as to implement a weighted average? Now, you can't reference the Microsoft-generated field because it's not implemented as a measure. That's exactly the scenario I faced while working on a financial report, although at the end I followed another approach to calculate the weighted average that didn't require a percentage of total. Anyway, the question remains. Is there a way to implement a "generic" percent of grand total for...
-
Solving iPad Issues with Power BI Secure Embed
January 24, 2023 / No Comments »
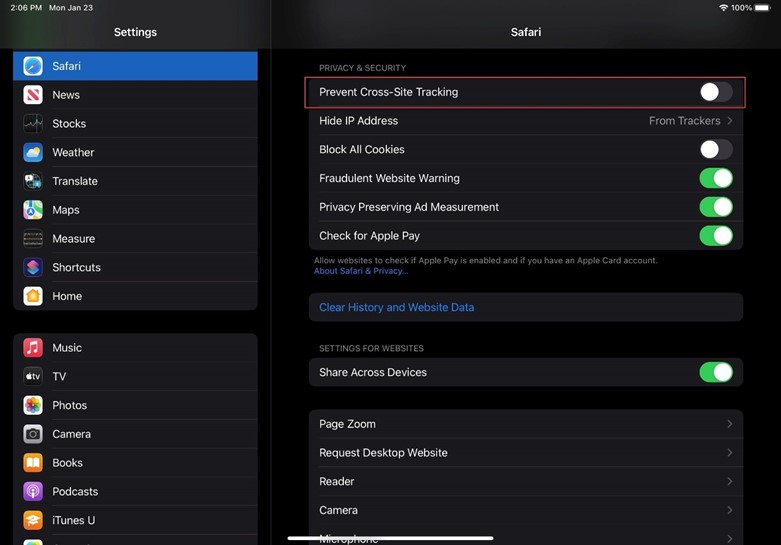
Scenario: You have an intranet web portal and use the Power BI secure embed feature (from the report menu, File->Embed report->Website or portal) to embed a report. However, the report doesn't render on iPad and iPhone devices. Instead, the user is perpetually asked to authenticate with Power BI. Solution: Apple has started preventing cross-site cookies to tighten up security. To resolve this horrible issue, each user must turn off this feature. On their iPad or iPhone device, go to Settings > your browser app, such as Safari or Chrome, and set Present Cross-Site Tracking to Off (assuming you are using Safari to render the web page).
-
Atlanta MS BI and Power BI Group Meeting on January 9th (Integrating Azure Synapse Analytics and Power BI)
December 26, 2022 / No Comments »

The Atlanta MS BI and Power BI Group is resuming in-person meetings! Please join us for the next meeting on Monday, January 9th, at 6:30 PM ET. Elayne Jones (Data Engineer at 3Cloud) will show you how to integrate Synapse with Power BI. For more details and sign up, visit our group page. WE ARE RESUMING IN-PERSON MEETINGS AT THE MICROSOFT OFFICE IN ALPHARETTA. WE STRONGLY ENCOURAGE YOU TO ATTEND THE EVENT IN PERSON FOR BEST EXPERIENCE. PLEASE NOTE THAT GUESTS ENTERING MICROSOFT BUILDINGS IN THE U.S. MUST PROVIDE PROOF OF VACCINATION OR SELF-ATTEST WITH HEALTHCHECK (HTTPS://AKA.MS/HEALTHCHECK). ALTERNATIVELY, YOU CAN JOIN OUR MEETINGS ONLINE VIA MS TEAMS. WHEN POSSIBLE, WE WILL RECORD THE MEETINGS AND MAKE RECORDINGS AVAILABLE AT HTTPS://BIT.LY/ATLANTABIRECS. PLEASE RSVP ONLY IF COMING TO OUR IN-PERSON MEETING. Presentation: Integrating Azure Synapse Analytics and Power BI Date: January 9th Time: 6:30 – 8:30 PM ET Place: Onsite and online ...
-
Report-enable Internal Portals with Power BI Reports
December 15, 2022 / No Comments »
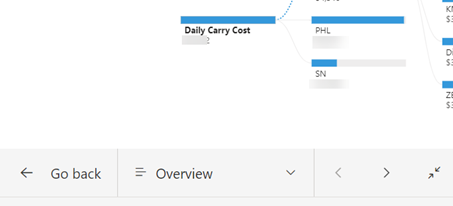
Expanding on my previous blog on this subject, there are three options to report-enable your Intranet portals with Power BI reports: Report link – This is the link to the report that you obtain from the browser address bar. If you want to report in full screen viewing mode (hiding the Power BI chrome), you can append the chromeless=1 query parameter to the URL, such as https://app.powerbi.com/groups/689c8ae3-0e22-44d1-9803-b6afdba4e583/reports/b60eaab4-9a85-47c3-8cde-e3a17e8f3dae/ReportSection?chromeless=1. If the "Display report pages as tabs along the bottom of the report" report setting is disabled, the report will be rendered with a few buttons at the bottom. Clicking "Go back" or exiting the full-screen view, will "restore" the Power BI portal chrome, allowing the user to gain access to the report action bar, such as to get report insights. This is the only option to have access to all commands in the report action bar. In addition, the users can store...
-
What Exactly is Microsoft Synapse?
December 4, 2022 / No Comments »
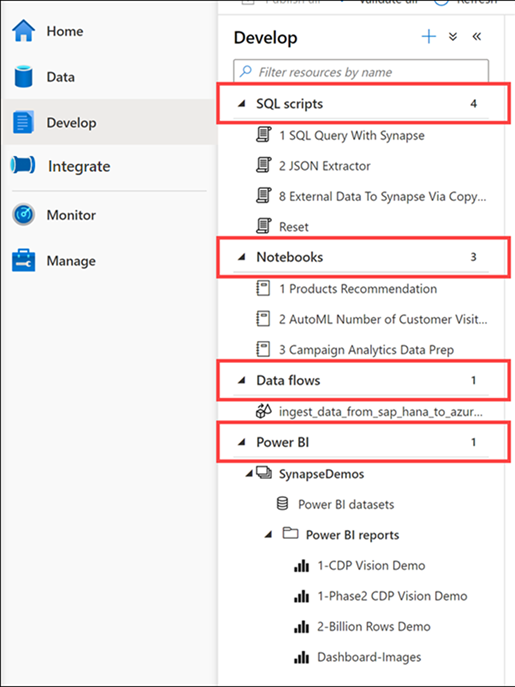
The other day an exalted customer shared that they've acquired Synapse and now they're ready for implementing semantic models with Power BI. The client wasn't sure how to give business users access to Synapse so cool self-service BI can finally start. In the process of the conversation, it became clear that they opened Synapse Studio and were left with the impression that Synapse has semantic modeling features. This is what happens when Marketing gets involved and people get confused about what a tool actually does. Let's attempt to clear this confusion. What's Synapse? Think of Synapse (aka Azure Synapse Analytics) as a umbrella name that spans multiple unrelated (or rather loosely) related services that are sold separately but are bundled together to fulfill a vision of a "unified analytical platform". This vision is further emphasized by Synapse Studio – an online tool to work with and monitor the Synapse services....
-
Testing DAX Measures
December 3, 2022 / No Comments »
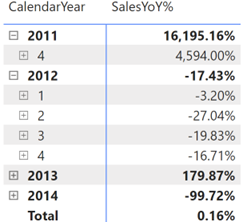
DAX can get complex and humble even experienced BI developers. Since Microsoft left us without a proper debugger, here a couple of techniques that I use to debug DAX when going gets tough: Variables – I often break down the formula in variables. As a bonus, variables make expressions easier to read and might yield performance gains. Consider the following SalesYoY% measure that calculates the variance in sales between the current period and same period last year. SalesYoY% = VAR _LastYearSales = CALCULATE ( [InternetSales], SAMEPERIODLASTYEAR ( 'Date'[Date] ) ) RETURN IF (NOT ISBLANK([InternetSales]), DIVIDE ([InternetSales] - _LastYearSales, _LastYearSales)) Let's say you believe that last year's sales look suspicious, such as the high value for 2011. You can comment the last line and return the LastYearSales variable to investigate further. SalesYoY% = VAR _LastYearSales = CALCULATE ( [InternetSales], SAMEPERIODLASTYEAR ( 'Date'[Date] ) ) RETURN _LastYearSales --IF (NOT ISBLANK([InternetSales]), DIVIDE ([InternetSales]...
-
Atlanta MS BI and Power BI Group Meeting on December 5th (Automate and Improve Planning, Budgeting and Forecasting)
November 29, 2022 / No Comments »

The Atlanta MS BI and Power BI Group is resuming in-person meetings! Please join us for the next meeting on Monday, December 5th, at 6:30 PM ET. Your humble correspondent will show you how to implement a custom solution for automating planning, budgeting, and forecasting based on a real-life project. For more details and sign up, visit our group page. WE ARE RESUMING IN-PERSON MEETINGS STARTING DECEMBER 5, 2022, AT THE MICROSOFT OFFICE IN ALPHARETTA. WE STRONGLY ENCOURAGE YOU TO ATTEND THE EVENT IN PERSON FOR BEST EXPERIENCE. PLEASE NOTE THAT GUESTS ENTERING MICROSOFT BUILDINGS IN THE U.S. MUST PROVIDE PROOF OF VACCINATION OR SELF-ATTEST WITH HEALTHCHECK (HTTPS://AKA.MS/HEALTHCHECK). ALTERNATIVELY, YOU CAN JOIN OUR MEETINGS ONLINE VIA MS TEAMS. WHEN POSSIBLE, WE WILL RECORD THE MEETINGS AND MAKE RECORDINGS AVAILABLE AT HTTPS://BIT.LY/ATLANTABIRECS. PLEASE RSVP ONLY IF COMING TO OUR IN-PERSON MEETING. Presentation: Automate and Improve Budgeting, Planning, and Forecasting Date: December 5th...

 We offer onsite and online Business Intelligence classes! Contact us about in-person training for groups of five or more students.