• Aggregates of Aggregates

    November 12, 2009 / No Comments »

    Aggregates of Aggregates

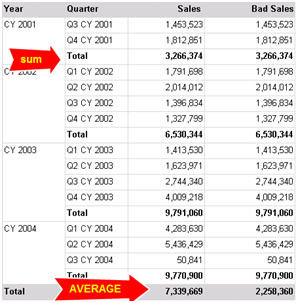
    Aggregates of aggregates is a new feature in SQL Server R2 Reporting Services. It can be better understood by the sample Aggregates.rdl report ([View:https://prologika.com/CS/cfs-file.ashx/__key/CommunityServer.Blogs.Components.WeblogFiles/blog/2474.aggregates.rdl]). It shows sales grouped by year and quarter. The Year group subtotals use the Sum aggregation function to sum the quarter sales. The report footer total averages the year subtotals. Prior to R2, authoring such a report would require dividing the total sales by the number of quarters, which you can obtain by using the CountRows function. You cannot just use the Avg function in the footer as the Bad Sales measure shows: =Avg(Fields!Internet_Sales_Amount.Value) If you do so, the Avg function would operate on the detail rows (all quarter rows) and it would produce 2,258,360. R2 lets you nest aggregate functions. The Sales footer total uses the following expression: =Avg(Sum(Fields!Internet_Sales_Amount.Value, "Year")) In this case, the Average function operates over the aggregated year subtotals. Note that not...

  • Where is the SSAS 2008 Book?

    November 10, 2009 / No Comments »

    Readers have been asking about a revised edition of my Applied Microsoft Analysis Services book for version 2008. First of all, I'd like to thank all my readers who bought and liked the book. This book has been a great success and it really exceeded my expectations in any way! It has great reviews on Amazon and it has sold over 10,000 copies to date, which is not a bad sales record for a technical book. I am still supporting my readers on the book discussion list and more than likely will continue doing so for foreseeable future. At the same time, I decided not to write a revision for SSAS 2008 or R2 for two main reasons: I just need a break from book writing. It took me several months to write the Applied Microsoft SQL Server 2008 Reporting Services and BI toolkit. I am not ready to start...

  • BIDS 2008 and R2 Project Support

    November 10, 2009 / No Comments »

    BIDS 2008 and R2 Project Support

    Continuing my intrepid journey in the SQL Server 2008 R2 land, I will discuss the new features of the recently-released CTP3. In this blog, I'll talk about the first new feature that caught my attention – BIDS support for 2008 and R2 projects. After hearing the outcry from many developers about project compatibility, in R2 Microsoft has decided to support both SQL Server 2008 and R2 report server projects. Similar to Analysis Services, Reporting Services now lets you target a server version in the project deployment settings. There is even a cool Detect Version link that would detect the SQL Server version based on the TagetServerURL setting. So, you can have a project that targets either edition. What happens when you use R2-specific features, such as the map control, but set the TargetServerVersion to SQL Server 2008? The map, Map1, was removed from the report. SQL Server 2008 Reporting Services...

  • SQL Server 2008 R2 November CTP (CTP3)

    November 10, 2009 / No Comments »

    Microsoft announced release on SQL Server 2008 R2 November CTP (CTP3) with a build number of #1352.12. MSDN, TechNet Subscribers and TAP customers can download the SQL Server 2008 R2 November CTP today. Non-subscribers will be able to access the CTP on Nov. 11th. This should be a feature-complete build that includes all SQL Server R2 functionality. Reporting Services The new Reporting Services features include: SharePoint Integration SharePoint Integration has several new features that include the following: Support for multiple SharePoint Zones. Support for the SharePoint Universal Logging service. A new data extension. A query designer for SharePoint Lists as a data source. Support for right-to-left text with Arabic and Hebrew in the SharePoint user interface. In a report, the data extension supports include data from SharePoint lists for SharePoint Foundation 2010, SharePoint Server 2010, Windows SharePoint Services 3.0, and Office SharePoint Server 2007. Report Parts. Shared Datasets and Cache...

  • The Aggregate Function

    October 29, 2009 / No Comments »

    Reporting Services supports an Aggregate function to retrieve aggregated values directly from the data provider if the provider supports this feature. The Aggregate function is especially useful with retrieving data from Analysis Services because it may be difficult if not impossible to recreate aggregated values on the report, such as when the cube script overwrites the server aggregates. It's easy to use the Aggregate function. Just replace the default Sum() aggregate function with Aggregate() in the group subtotals. When you do this, the Analysis Services provider brings in additional rows that include the server aggregates which the report displays in the group subtotals. Recently, I came across a report that would return the following exception after attempting to use Aggregate(). The Value expression for the text box ''<textbox.' uses Aggregate with an invalid scope parameter. I couldn't find anything wrong with the way Aggregate() is used because it was in...

  • Why We Can’t Connect Anymore?

    October 28, 2009 / No Comments »

    New OS (Windows 7 in this case) and new issues when trying to connect to Analysis Services on a remote server. I installed Windows 7 and added it to a corporate domain. I can use SSMS to connect to some SSAS servers but there was one server (the most important of course) which refused the connections with the following dreadful message which I am sure you've seen somewhere along the line:   TITLE: Connect to Server ------------------------------ Cannot connect to <servername>. ------------------------------ ADDITIONAL INFORMATION: The connection either timed out or was lost. (Microsoft.AnalysisServices.AdomdClient) ------------------------------ Unable to read data from the transport connection: An existing connection was forcibly closed by the remote host. (System) ------------------------------ An existing connection was forcibly closed by the remote host (System)   I was able to connect to that server from other non-Windows 7 machines so I narrowed the issue to Windows 7. Interestingly, running the...

  • Applied Analysis Services 2008 Online Training Class with Teo Lachev

    October 24, 2009 / No Comments »

    Applied Analysis Services 2008 Online Training Class with Teo Lachev

    We are excited to announce the availability of an online Analysis Services 2008 class – no travel, no hotel expenses, just 100% content delivered right to your desktop!  This intensive 3-day online class (14 training hours) is designed to help you become proficient with Analysis Services 2008 and acquire the necessary skills to implement OLAP and data mining solutions. Learn how to build an Adventure Works cube from scratch. Use the opportunity to ask questions and study best practices.. Applied Analysis Services 2008 Online Training Class with Teo Lachev Date: November 16 – November 18, 2009 Time: Noon – 4:30 pm EDT; 9 am – 1:30 pm PDT 14 training hours total for only $799!  Attend this class for only $799 and get a free unrestricted e-book copy of the book Applied Analysis Services 2005 by Teo Lachev! For more information or to register click here!

  • Phantom URLs

    October 20, 2009 / No Comments »

    Phantom URLs

    An interesting "issue" popped up today. I did a fresh install of Windows 7 on my brand new HP 8530w laptop, which is a great laptop BTW. I install SQL Server 2008 followed by SP1 only to find that the Web Service URL and Report Manager URL don't show up in the Reporting Services Configuration Manager. The report sever would run just fine on http://localhost/reportserver and the URLs were registered correctly in the rsreportserver.config. I went as far as whipping out some WMI code and it would return the URLs as it should. But the darn URLs won't show up. Not to mention that another user has recently reported the exact same issue to me. A bug? I started thinking of re-installing SQL Server. Then, a Eureka moment! As with most things, there was an easy explanation. For some reason, Windows 7 has set the system font size to be 125%. Resetting it to...

  • Intelligencia for Silverlight

    October 19, 2009 / No Comments »

    Intelligencia for Silverlight

    After retiring Office Web Components (OWC), which can hardly can pass the web test as it is implemented as an ActiveX control, Microsoft left developers with no web-based browser for Analysis Services. True, for those who can afford the hefty price tag, Microsoft Office SharePoint Server (MOSS) supports server-side Excel spreadsheets that render to HTML. However, while Excel rules the Windows-based OLAP browser space, HTML-based Excel spreadsheets with limited filtering can hardly meet the demand for web-based interactive reporting. Then, there is an option to author Reporting Services OLAP reports but outside limited interactive features their layout is pretty much fixed at design time. What's really needed is a Silverlight Analysis Services control that ships with Visual to let developers embed an Excel-like Analysis Services browser into their ASP.NET applications. You need this control and I need it but it's not coming anytime soon. Meanwhile, third-party vendors rush in to...

  • Aggregating Many-to-Many Relationships

    September 18, 2009 / No Comments »

    Aggregating Many-to-Many Relationships

    Relax…this blog is all about Analysis Services and not about polygamy or something worse. SSAS 2005 went beyond the "classic" OLAP model by introducing flexible dimension-to-measure group relationships, including many-to-many, referenced, fact relationships. M2M relationships can solve some nagging business problems. For example, in a recent project where we had to implement a financial cube, there was a requirement that a G-L account can belong to multiple account groups. This is a classic M2M scenario which can be elegantly solved by introducing a M2M relationship. Adventurizing this, let's take a look at this schema. Here, I changed the Adventure Works schema by adding a DimGroup and DimGroupEmployee tables. The DimGroup dimension is a parent-child dimension that lets the end user slice data by territory. An employee can be associated with one or more territories (think of a sales manager that covers multiple territories. This M2M relationship (groups-territories) is resolved via...

Training

We offer onsite and online Business Intelligence classes! Contact us about in-person training for groups of five or more students.
For more information or to register click here!

Books

Learn Power BI at your own pace with our latest book Applied Microsoft Power BI. Targeting information workers, data analysts, pros, and developers, It is designed as an easy-to-follow guide for learning how to implement BI solutions spanning the entire personal-team-organizational BI spectrum.

Syndication