-
Report Parts
November 24, 2009 / 2 Comments »
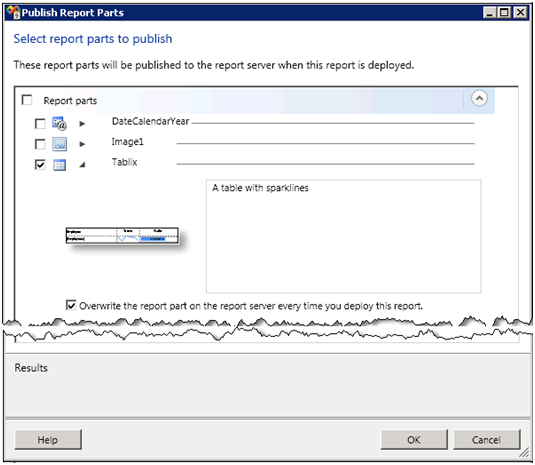
The major new R2 feature that debuts in CTP 3 (November CTP) of SQL Server 2008 R2 Reporting Services is report parts. A report part is a fragment of a report definition that you can publish to the report server to facilitate best practices and reuse. Just like a developer can refactor and share some piece of code, the report author can re-factor a portion of a report and publish it to the server so that end users can use it as it-is. The following report items can be published as report parts: Charts Gauges Images Maps Parameters Rectangles Tables Matrices Lists A notable exception to this list is page headers and footers which are probably the most likely candidates for reuse but at this point they didn't make the list. It's important to note that if a data region uses a report-specific dataset (not a shared dataset), publishing the...
-
Cumulative Update Package 5 for SQL Server 2008 Service Pack 1
November 20, 2009 / 2 Comments »
Microsoft released Cumulative Update Package 5 for SQL Server 2008 Service Pack 1 (build 10.00.2746). Among other things, if fixes an SSRS issue with printing and conditional visibility of recursive groups which I reported.
-
Sparklines and Data Bars
November 20, 2009 / No Comments »
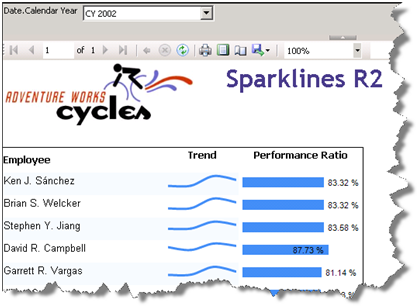
Besides indicators, R2 adds sparklines and data bars to the arsenal of data visualization features. Sparklines are small graphics embedded in a context of words, numbers, and images. They help end users visualize simple trends. You could implement sparklines and simple data bars in the previous versions of Reporting Services but you had to go through many steps to strip down the chart or gauge regions. R2 makes the process much simpler. Let's see what it takes to author a sparkline report with R2 that is similar to the Sparklines report included in my book source code. [View:https://prologika.com/CS/cfs-file.ashx/__key/CommunityServer.Blogs.Components.WeblogFiles/blog/6175.Sparklines-R2.rdl] This report helps the user visualize the performance of the Adventure Works sales persons. For each person, the report shows the employee's trend based on the reseller sales made over four quarters and his performance ratio which is defined as the actual sales made by the employee divided by his sales quota....
-
Indicators
November 19, 2009 / No Comments »
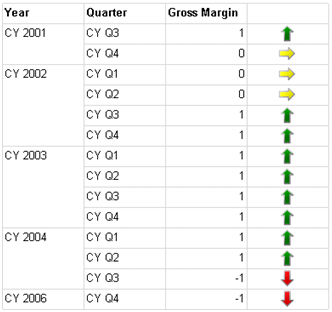
Often, reports need to show images that represent discrete values, such as an image that shows a KPI status. Previously, you didn't have another option but to use images that are dynamically changed based on the field value. Indicators, a new R2 feature, make this much simpler. In Reporting Services, an indicator is a simplified gauge region that lets you associate images with states. Although you can use indicators as stand-alone regions, you would typically nest them in a tablix, as the following report [View:https://prologika.com/CS/cfs-file.ashx/__key/CommunityServer.Blogs.Components.WeblogFiles/blog/8712.IndicatorDemo.rdl] demonstrates. The right-most column of this report shows the Gross Margin KPI status as an indicator. Authoring this report takes a few simple steps: Add a dataset that requests the Status property of the Financial Gross Profit Margin KPI from the Adventure Works 2008 Analysis Services cube grouped by Year and Quarter. Use a tablix region to show the KPI status with Year and Quarter...
-
Pagination and Rendering Enhancements
November 17, 2009 / No Comments »
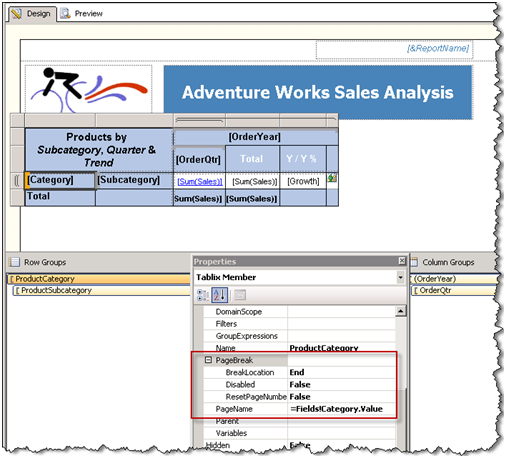
R2 brings more control over pagination and rendering. A question that pops every now and then on the discussion list is how to name Excel worksheets for each instance of a row group. This scenario wasn't supported before R2. In R2, there are addition page break options, as shown in the screenshot below. One of them is PageName. In this case, I set the PageName property of the ProductCategory row group to the Category field. Then, I set up the BreakLocation of the ProductCategory row group to break when the product category changes. The screenshot below shows what the exported to Excel report looks like. As you can see, each worksheet is now named. If the row group spills on the next page, a new worksheet is added with the same name. Another welcome enhancement is the ability to reset page numbering. Suppose you have a master report that includes...
-
Shared Datasets
November 16, 2009 / No Comments »
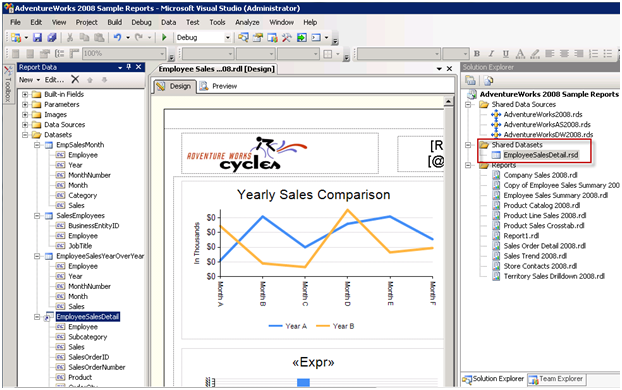
When the Reporting Service team asked my opinion about shared datasets, a new feature in the forthcoming SQL Server Reporting Services R2, I was somewhat skeptical. I preferred them to focus on more important in my mind features, such as the ability to join datasets at report level. But the more I look at the way shared datasets got implemented, the more real-life scenarios I think may benefit from this enhancement. Think of a shared dataset a hybrid between a shared data source and report execution. Similar to a shared data source, a shared dataset is a report dataset that can be managed independently and shared among reports. A shared dataset must use a shared data source. The shared datasets can be parameterized and reports that use it can pass parameters to it. Similar to report executions, a shared dataset can also be cached and refreshed on a schedule. In...
-
Not All Calculated Members Are Born Equal
November 13, 2009 / No Comments »
An interesting issue popped up yesterday regarding the calculated member syntax. I had to multiply negative amounts in a financial cube for certain account categories that had negative amounts. The cube also had a Many:Many relationship between financial accounts and account groups which may be related to the issue. So, I had the following scope assignment: CREATE MEMBER CURRENTCUBE.[Multiplier] /* Old Style*/ AS [Financial Account].[Financial Account Hierarchy].CurrentMember.Properties("Multiplier", TYPED), VISIBLE = 0; Scope ( [Financial Account].[Financial Account Hierarchy].Members ); this = [Financial Account].[Financial Account Hierarchy].CurrentMember * [Measures].[Multiplier]; End Scope; The Multiplier calculated member returns the Multiplier property of the current account member, which could be 1 or -1 (if the account has to be negated). Then, the scope assignment overwrites all measures for the current member. As simple as it is, the assignment didn't work and the account amounts didn't get converted although the Multiplier calculated member would return the correct...
-
Aggregates of Aggregates
November 12, 2009 / No Comments »
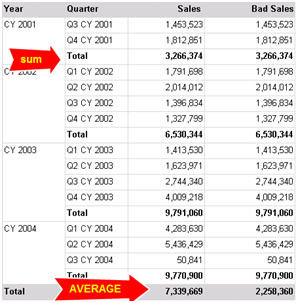
Aggregates of aggregates is a new feature in SQL Server R2 Reporting Services. It can be better understood by the sample Aggregates.rdl report ([View:https://prologika.com/CS/cfs-file.ashx/__key/CommunityServer.Blogs.Components.WeblogFiles/blog/2474.aggregates.rdl]). It shows sales grouped by year and quarter. The Year group subtotals use the Sum aggregation function to sum the quarter sales. The report footer total averages the year subtotals. Prior to R2, authoring such a report would require dividing the total sales by the number of quarters, which you can obtain by using the CountRows function. You cannot just use the Avg function in the footer as the Bad Sales measure shows: =Avg(Fields!Internet_Sales_Amount.Value) If you do so, the Avg function would operate on the detail rows (all quarter rows) and it would produce 2,258,360. R2 lets you nest aggregate functions. The Sales footer total uses the following expression: =Avg(Sum(Fields!Internet_Sales_Amount.Value, "Year")) In this case, the Average function operates over the aggregated year subtotals. Note that not...
-
Where is the SSAS 2008 Book?
November 10, 2009 / No Comments »
Readers have been asking about a revised edition of my Applied Microsoft Analysis Services book for version 2008. First of all, I'd like to thank all my readers who bought and liked the book. This book has been a great success and it really exceeded my expectations in any way! It has great reviews on Amazon and it has sold over 10,000 copies to date, which is not a bad sales record for a technical book. I am still supporting my readers on the book discussion list and more than likely will continue doing so for foreseeable future. At the same time, I decided not to write a revision for SSAS 2008 or R2 for two main reasons: I just need a break from book writing. It took me several months to write the Applied Microsoft SQL Server 2008 Reporting Services and BI toolkit. I am not ready to start...
-
BIDS 2008 and R2 Project Support
November 10, 2009 / No Comments »

Continuing my intrepid journey in the SQL Server 2008 R2 land, I will discuss the new features of the recently-released CTP3. In this blog, I'll talk about the first new feature that caught my attention – BIDS support for 2008 and R2 projects. After hearing the outcry from many developers about project compatibility, in R2 Microsoft has decided to support both SQL Server 2008 and R2 report server projects. Similar to Analysis Services, Reporting Services now lets you target a server version in the project deployment settings. There is even a cool Detect Version link that would detect the SQL Server version based on the TagetServerURL setting. So, you can have a project that targets either edition. What happens when you use R2-specific features, such as the map control, but set the TargetServerVersion to SQL Server 2008? The map, Map1, was removed from the report. SQL Server 2008 Reporting Services...
Training
 We offer onsite and online Business Intelligence classes! Contact us about in-person training for groups of five or more students.
For more information or to register click here!
Books
 Learn Power BI at your own pace with our latest book Applied Microsoft Power BI. Targeting information workers, data analysts, pros, and developers, It is designed as an easy-to-follow guide for learning how to implement BI solutions spanning the entire personal-team-organizational BI spectrum.


