-
Power BI vs. Tableau (Part 3)
November 10, 2017 / No Comments »

Feeling the heat, Tableau has come up with an updated Power BI vs. Tableau battle card as one of my clients pointed out. This time designed as a video. I guess the previous "10 Ways Power BI Falls Short" slide deck, which I discussed in the part 1 and part 2 of my "Power BI vs. Tableau" blog , wasn't effective enough. I concur given the large number of customers abandoning the tool. Tableau is desperately trying to breathe new life into their aging software by a series of acquisitions to stay competitive but they're now fighting an uphill battle. And their marketing materials should have a timestamp because Power BI improves every month and points get outdated quickly (see the first part 1 of my blog). But let's take a look at the latest battle card so we are better positioned to answer the question asked by Tableau "Which one...
-
Hey Cortana, where is Power BI data?
November 6, 2017 / No Comments »
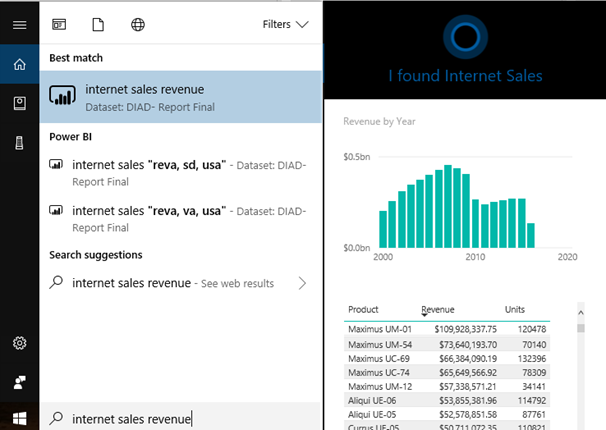
A Power BI presentation is rarely complete if someone doesn't ask me to demonstrate the Cortana integration. However, unlike everything else in Power BI that gains features in time, in my opinion the Cortana experience has lost some value. Previously, you could ask natural questions in Cortana across datasets, just like you can use the Power BI Service Q&A to gain insights from dashboards. Unfortunately, Microsoft has removed this feature in favor of searching for report pages that are specifically optimized for Cortana (also known as Cortana answer cards). You can also search dashboards and reports by name but that won't get you the "vow" effect since 1) you need to know the name and 2) when you click the name Cortana opens Power BI in a separate browser window. So much about natural queries and machine learning. I think the change took place after Microsoft decided to move away...
-
Power BI Service in Get Data
November 5, 2017 / 1 Comment »
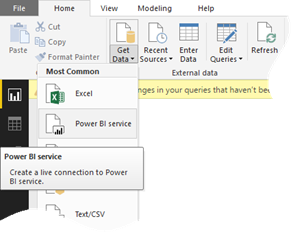
Scenario: You have published a Power BI Desktop file with a report to Power BI Service. You want to give certain users access to some pages in the report. This is not a security mechanism although it could be, if you want to control security at the report layer. Solution: When a customer asked about this scenario, my first thought was to create reports directly in Power BI Service. For example, the report that's included in the Power BI Desktop file could have some visuals that you might want to share with everyone. Then, you create additional reports for each group of users and share them via dashboard sharing. This approach will work but if someone nukes the dataset, your reports go down with it. True, you can export a report connected to a dataset created in Power BI Desktop but who bothers to back up reports on a regular basis?...
-
Power BI DirectQuery with Parameterized Stored Procedure
October 31, 2017 / No Comments »
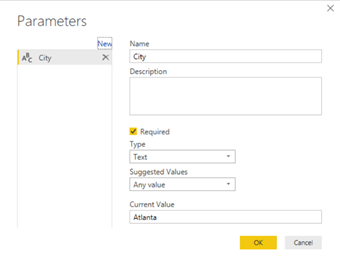
Issue: You have a parameterized SQL Stored procedure that you want to call in DirectQuery mode. You attempt to use "exec sp parameter" syntax in the Power BI Desktop which works in the Query Editor but it fails to execute due to syntax error when you apply changes. Workaround: Power BI uses the "select * from exec sp" syntax which doesn't work. However, if you switch to OpenRowset (you'd need to enable ad hoc distribution queries on the database first), it will work. Other possible workarounds that would probably work is inserting the stored procedure results into a temp table and then select from the table, or wrapping the stored procedure with user-defined table function. I attach a sample that demonstrates the OpenRowset approach. Download the Stored Procedure Direct Query.zip file (link provided at the end of this post) and rename the from *.zip to *.pbix. Here is the query...
-
Understanding Dates in Power BI Quick Measures
October 22, 2017 / No Comments »
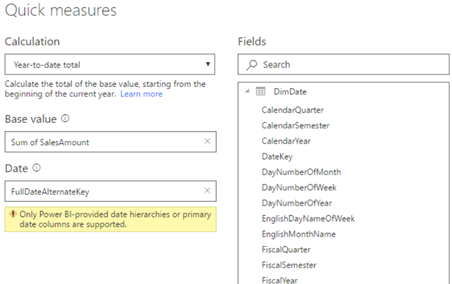
As I explained here, Power BI introduced the highly anticipated Quick Measures feature to avoid writing DAX formula for common measures. The feature is still in preview, so make sure you enable it in Power BI Desktop from File, Options and Settings, Options, Preview Features. Many quick measures, such as time intelligence calculations (YTD, QTD, Period Over Period Change, etc.), rely on a date field. The date field could come from a Power BI-provided date hierarchy or a Date table. Letting Power BI auto-generate date hierarchies is easy but dangerous and limiting. As Chris Webb explains here, Power BI-provided hierarchies could bloat the size of the data model. For example, by disabling them in data in a data model provided by a customer, I was able to reduce the data model size from 300 MB to 30 MB! Instead, a best practice is to have a Date table. It gives...
-
Power BI Bookmarks
October 9, 2017 / No Comments »

So far, Power BI has lacked the ability to navigate to particular report element, such as another report page, and to allow you to show/hide visuals. For example, Tableau allows you to add buttons to pages and navigate to another page on button click. Such navigation capabilities are important for story telling and for emphasizing elements on the screen. This changes with the October release of Power BI Desktop which brings a set of navigation capabilities, including bookmarks, spotlight, and selection page. Suppose you have a meeting and walk management through the sales performance of your company. You start with a bar chart. There is a decrease in sales in which you can explain by using the Analyze Increase/Decrease which I discussed here. Now you have two visuals on the same page: But at the beginning of your presentation, you'd want to bring focus on the bar chart, explain the...
-
Configuring Power Query OData Feeds
October 5, 2017 / No Comments »

Scenario: A customer has implemented a Power BI model that retrieves data by calling the Dynamics CRM OData Feed endpoint. The dataset refresh operation is timing out. They want to increase the timeout setting but unlike connecting to SQL Server, where you can set the timeout duration in the source advanced properties, there is no UI for ODATA. Solution: If you open the query behind the table, and click the Source step, you'll see in the Query Editor formula bar the following M code: = OData.Feed("https://<tenant>.api.crm.dynamics.com/api/data/v8.1/") From the documentation, we realize that OData.Feed can take additional settings and one of them is the Timeout setting that you can pass to the third options argument. For example, you can change the M code to set the timeout to 1 hour: = OData.Feed("https://<tenant>.api.crm.dynamics.com/api/data/v8.1/", null, [Timeout=#duration(0,1,0,0)]) The timeout uses the duration data type which is explained here. Bringing this one step further, you...
-
Power BI Premium Reports on Mobile Devices
October 1, 2017 / No Comments »
Can we surface Power BI reports deployed to Power BI Premium Report Server on mobile devices? Yes, and we have three quick options: Since Power BI reports render in HTML5, they should render in any modern browser. On iOS and Android devices, consider Power BI Mobile for optimum viewing experience. In Power BI Mobile, go to the Settings and click Connect to Server. Then plug in the report server URL, e.g. http://<servername>/reports. Note that the Power BI Mobile Windows app doesn't support Power BI Premium Report Server yet. Also, by default your reports will only work if you are on your company intranet or the mobile device connects to your company VPN. To make reports available outside corporate network, you can configure a Web Application Proxy to tunnel in. For embedding reports on a page, have an HTML page with iframe that request the report by URL passing the embed...
-
How Do We Start?
September 27, 2017 / No Comments »

How do you start a data warehousing project? Not much different than any complex software project. You break it down to small iterations, e.g. by subject area, design and implement each iteration from beginning to end, and deploy to deliver incremental value. Agile? Perhaps. In my career I've seen software methodologies come and go so I'd abstain from applying a label. The main goal is to break complex tasks in smaller increments. You can call it agile if you want. But if I must meet every day for 15 minutes and hold hands (I had to do this a while back because my employer was agile, believe me), or deliver some crappy code in some predefined timeframes (sprints), then agile I am not. So you stated your first iteration (typically Sales as revenue is an important metric to track). Now what? Next, we identify metrics, aka measures. Should you reverse...
-
Atlanta MS BI Group Meeting on September 25th
September 24, 2017 / No Comments »

MS BI fans, join me for the next Atlanta MS BI and Power BI Group meeting on September 25th at 6:30 PM. Carlos Rodriquez and Daniel Granadillo from Brightstar will share their experience with Power BI and QlikView. Accelebrate will sponsor the meeting. And your humble correspondent will show you two new cool Power BI features: drillthrough to page and explain increase/decrease. Presentation: Did Qlik run out of BI Power? Level: Intermediate Date: September 25, 2017 Time 6:30 – 8:30 PM ET Place: South Terraces Building (Auditorium Room) 115 Perimeter Center Place Atlanta, GA 30346 Overview: Haters are gonna hate. Lovers are gonna love. What about you? Come decide by yourself whether you are a Qlik or a PBI guy/gal. This presentation is intended for anyone who wants to see these two BI tools in action. Carlos and Daniel will show the differences and similarities between QlikView and Power BI. They will perform...

 We offer onsite and online Business Intelligence classes! Contact us about in-person training for groups of five or more students.