-
Integrate SSRS 2016 Reports with Power BI
December 18, 2015 / No Comments »

As I said in the "Microsoft Unveils BI Roadmap" blog, SSRS will play an important role of the on-premises BI portal. With this post, I'll start covering the new SSRS 2016 features. One of the Power BI features announced at the PASS Summit was the forthcoming integration between SSRS 2016 and Power BI that will allow users to pin SSRS report items to Power BI dashboards. You can test pining reports items to Power BI with SQL Server 2016 CTP 3.0 and later. The newly released CTP 3.2 also features the new sleek SSRS portal (we've come a long way!). The items you can pin currently include charts, gauge panels, maps, and images. Pinning a report item takes a few clicks: Open the report and click the Power BI button (a new toolbar button in SSRS 2016). If this is the first time you do this, you'll be asked to...
-
The One and Only Power BI Book
December 16, 2015 / No Comments »

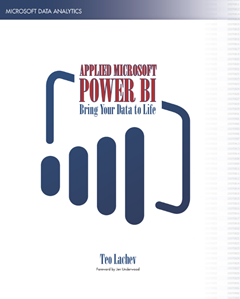
To me, Power BI is the most exciting milestone in the Microsoft BI journey since circa 2005, when Microsoft got serious about BI. Power BI changes the way you gain insights from data; it brings you a cloud-hosted, business intelligence and analytics platform that democratizes and opens BI to everyone. I'm happy to announce my latest (7th) book – Applied Microsoft Power BI. Currently, the one and only book on Power BI. Some people discouraged me to write this one. After all, trying to cover a product that changes every week is like trying to hit a moving target. However, I believe that the product's fundamentals won't change and once you grasp them, you can easily add on knowledge as Power BI evolves over time. Because I had to draw a line somewhere, "Applied Microsoft Power BI" covers all features that were announced at the PASS Summit 2015 and that...
-
Announcing Sparkline Visual
November 20, 2015 / No Comments »

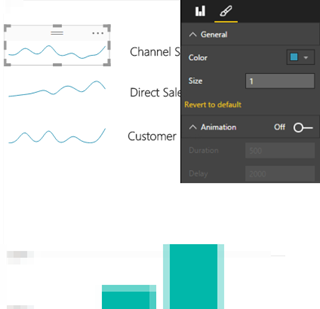
A sparkline is a miniature graph, typically drawn without axes or coordinates. Commonly used on dashboards, sparklines typically visualize trends over time, such as to show profit over the past several years. Although other Microsoft reporting tools, such as Excel and Reporting Services include sparkline elements, Power BI doesn't have one. That is until now. I contributed a "classic" sparkline custom visual to the Power BI Visuals Gallery. Once you import and add the sparkline to a report, you bind the sparkline to data using the Data tab of the Visualization pane. For example, you can aggregate a Freight field added the Value area over the CalendarQuarterDesc field added to the Category area. The resulting graph will sho how freight fluctuates over time. You can use any field to group the data, not just a field from the Date table. The sparkline supports several formatting options. The General section lets...
-
New Tabular Schema in SQL Server 2016
November 13, 2015 / No Comments »
Those of you who had to generate programmatically Tabular models or make changes to the schema would agree that it was more complicated that it should have been. That's because Tabular borrowed the schema from Multidimensional so objects had to be defined in different places and in the SSAS MD terminology (dimensions, DSVs, etc). SQL Server 2016 CTP3 brings a new and much more simplified Json-based schema for describing SSAS Tabular models. To see it, you need to configure your workspace database in SQL Server 2016 (1200) compatibility mode. SSMS doesn't yet support the new schema but you can take a look at Model.bim once you create your project. When you open the source of the Model.bim file you'll see something completely different than the XML schema you were used to: { "name": "SemanticModel", "id": "SemanticModel", "compatibilityLevel": 1200, "readWriteMode": "readWrite", "model": { "culture": "en-US", "dataSources": [ { "name": "DW", "connectionString":...
-
Introducing Office Online Server
November 4, 2015 / No Comments »
Continuing the line of thought from my previous blog "Microsoft Unveils BI Roadmap", one nagging question still remains. What to do with all these Excel files now that SSRS came with a vengeance and has been promoted to THE on-premises BI platform? It looks like Microsoft is thinking along these lines. Interestingly, Excel Services will be removed from SharePoint Server 2016 and replaced with Office Online Server, as explained here. And this page gives more details about Office Online Server which is currently in preview. In a nutshell, Excel rendering would work pretty much in the same way as in SharePoint Server 2013. The most common scenario that Microsoft plans now is to have the Excel workbook in SharePoint. When you open the workbook, SharePoint will redirect you to the Office Online Server using a WOPI frame (some sort of an Iframe), with some special tokens that enable Office Online...
-
Microsoft Unveils BI Roadmap
October 29, 2015 / No Comments »

Today at the SQL PASS Summit 2015, Microsoft shared its BI roadmap for next year and beyond. The BI cloud roadmap shouldn't be a surprise to anyone. It's centered around Power BI. The main takeaway about the on-premises roadmap is deemphasizing the role of SharePoint and Office in favor of Reporting Services. In SQL Server 2016, SSRS will be extended to support Datazen reports. A future SQL Server update would support publishing Power BI Desktop files as well. "Just as we've added mobile report delivery to SSRS in SQL Server 2016, we intend to add governed Power BI Desktop report delivery in the future." Although this news will surely cause some commotion in a short term, I believe it's a good news for customers and BI practitioners in a long term. For customers, you no longer need SharePoint and SQL Server Enterprise licenses if all you need is sharing some...
-
Power BI Embedded Dashboards Without Authentication UI
October 19, 2015 / 16 Comments »

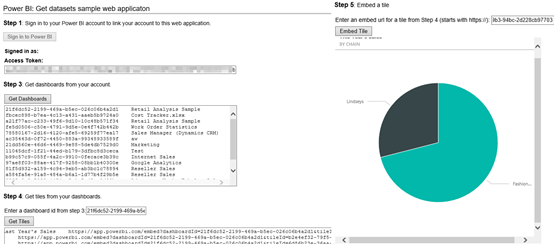
UPDATE: An updated sample is included in the Chapter 12 source code of my "Applied Power BI" book. One of the biggest Power BI strengths is its open architecture. In addition to opening the visualization framework, Power BI introduced REST APIs that let developers embed dashboard tiles in custom web applications (embedded reports will probably follow soon). Microsoft provided a sample application (Integrate-a-tile-into-an-app) on GitHub to demonstrate how dashboard tile embedding works. This application navigates the user to an authentication UI where the user signs it to Power BI before the application can access the user content. However, there are plenty of embedded reporting scenarios where this isn't desirable. For example, you might have a web application that already authenticates users with Forms Authentication and you don't want to ask the user to log in to Power BI again. Instead, you might want to pass the identity of the authenticated...
-
SQL Server MVP for 12 Years
October 6, 2015 / No Comments »
Microsoft awarded me again with the Most Valuable Professional (MVP) Award for SQL Server. This is an annual prestigious award given to selected individuals worldwide in recognition for their expertise and contribution to the community. Currently, there are 371 SQL Server MVPs worldwide and only 85 in the USA. This makes it 12 consecutive years for me as SQL MVP!
-
Atlanta MS BI Group September 28th Meeting
September 26, 2015 / No Comments »
Come and join us on Monday, September 28th, for our next Atlanta MS BI Group meeting. The topic this time is "Enhancing Data Analysis and Predictive Analytics with NoSQL" delivered to you by RDA Consulting. Presentation:Enhancing Data Analysis and Predictive Analytics with NoSQL Level: IntermediateDate:Monday, September 28th, 2015Time6:30 – 8:30 PM ETPlace:South Terraces Building (Auditorium Room) 115 Perimeter Center Place Atlanta, GA 30346Overview:The pervasiveness of Big Data has created significant challenges for companies that have historically utilized relational database management systems to perform data analysis and predictive analytics. This presentation outlines the challenges that stem from Big Data as it relates to deriving value from data, the types of NoSQL data stores available and how NoSQL can serve as a data platform that enhances the data analysis and predictive analytics capabilities of companies.Speaker:Cornell A. Emile is a Senior Software Engineer with RDA Corporation. Since 2001, he has designed, developed, and maintained...
-
Power BI Report Embedding on the Horizon
September 26, 2015 / No Comments »
For years I've been harassing Microsoft to support embedding interactive reports connected to SSAS on custom apps. This feature has been sorely missing in the Microsoft BI stack. Yet, it's a must-have feature that enables a wide range of integration scenarios, such as customer-facing reporting. Imagine your customers being able to ask natural questions for data exploration. This is a killer feature! It looks like Power BI might finally bring some relief. I while back, I posted an Embedding Reporting feature wish on the Power BI discussion list. It now has 643 votes and it's one of the most voted for features. Recently, when asked to provide feedback, I communicated to Microsoft how I envision report embedding to work: Developers must have the ability to embed reports/dashboards in applications. This should be conceptually similar to how they can do this now with ReportViewer. However, instead of an ASP.NET control, I'd...

 We offer onsite and online Business Intelligence classes! Contact us about in-person training for groups of five or more students.


