-
Office 2013 Business Intelligence Highlights
July 25, 2012 / No Comments »
Jen Underwood wrote a great summary about what's new in Office 13 BI. Interestingly, you'll be able to drill down to lower location in the Power View maps, e.g. from country to state and then to lowest level you placed in the location zone when configuring the map visualization.
-
Localizing Reports in SharePoint
July 23, 2012 / No Comments »
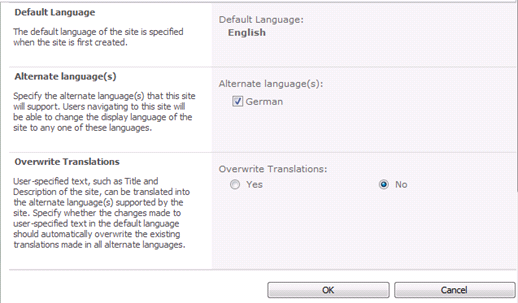
In a current project, international users indicated that they prefer dates and numbers to be formatted using their regional settings. Localization is a big and complicated topic and we've been fortunate that the scope was limited to just number and date formatting … or, at least so far. Localizing reports on a report server running in native mode is easy. You just need to use culture –neutral format strings, e.g. C for currency of P for percentage, and set the report-level Language property to =User!Language. However, this is not enough for reports running in a SharePoint integrated mode. SharePoint requires installing language packs as follows: For each language you plan to support, download the corresponding language pack. For example, to download the German language page, change the drop-down to German and download the pack. Log in a SharePoint Farm Administrator and install the language pack. At the end of the...
-
What’s New in Office 2013 BI: Part 1 – Personal BI with Excel
July 23, 2012 / No Comments »
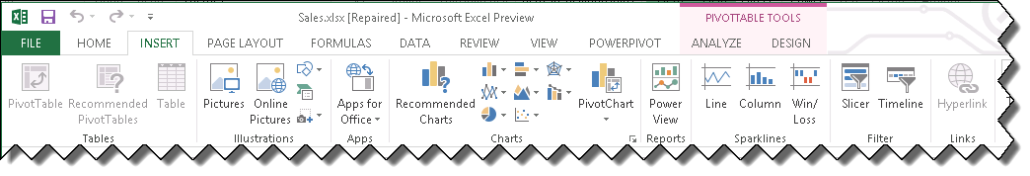
As you probably know by now, Microsoft unveiled the Office 2013 Technology Preview. As the portal page says, "we've Taken Self-Service BI to the Next Level". Indeed, this is where I believe we'll see Office 2013 emerging as a leading tool on the market for self-service BI. Based on my experience, business users love Excel 2010 with PowerPivot because of its familiar environment and ease of use. However, the Excel visualization capabilities have been lacking. As familiar as they are, pivot table reports are getting somewhat outdated. This is why I put enhanced visualization options on my wish list. This all changes in Office 2013 where the question won't be "Why we don't have modern visualization options?" but "Which visualization option should I use?" Microsoft decoupled Power View from SharePoint and added it to Excel to allow business users to create ad-hoc Power View reports that source data from the...
-
Formatting Calculated Members
July 2, 2012 / No Comments »
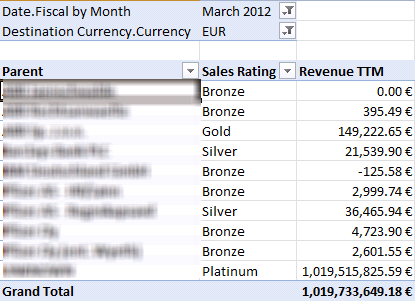
Consider the following calculated member definition added to the script in an Analysis Services cube: CREATE MEMBER CURRENTCUBE.[Measures].[Revenue TTM] AS ([Measures].[Revenue Amount USD], [Relative Date].[TTM]), FORMAT_STRING = "Currency", VISIBLE = 1; When you browse the member in Excel, you'll find that the member is not formatted as currency. However, when you use SSMS and query the member, when you double-click the member cell in the query results, you'll see that the value is formatted as expected. Clearly, Excel has an issue with formatting calculated members and there is a connect bug report that has been quietly sitting in the Excel bucket for years. To Microsoft credit, we have a KB article "Description of the LANGUAGE cell property in SQL Server 2005 Analysis Services". "However, SQL Server 2005 Analysis Services cannot determine the value of the LANGUAGE cell property or of the currency symbol for calculated members from the query context....
-
MS BI Guy Does Hadoop (Part 5 – The Big Picture)
July 1, 2012 / No Comments »
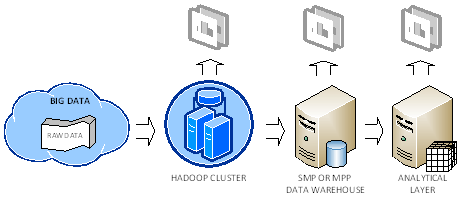
Let's recap my thoughts on Hadoop. I've found the case studies presented in the chapter 16 of the "Hadoop: The Definitive Guide" book very useful to understand how organizations are currently using Hadoop. In general, the following deployment scenario emerges as a common pattern: An organization accumulates Big Data from various sources, such as web logs, sensors, website traffic, and so on. The organization decides to store the raw data in the Hadoop fault-tolerant file system (HDFS). As far as cost, RainStor published an interesting study about the cost of running Hadoop. It estimated that you need an investment of $375 K to store 300 TB which translates to about $1,250 per terabyte before compression. I reached about the same conclusion from the price of single PowerEdge C2100 database server, which Dell recommends for Hadoop deployments. Note I favor the term "raw data" as opposed to unstructured data. In my...
-
MS Guy Does Hadoop (Part 4 – Analyzing Data)
June 30, 2012 / No Comments »
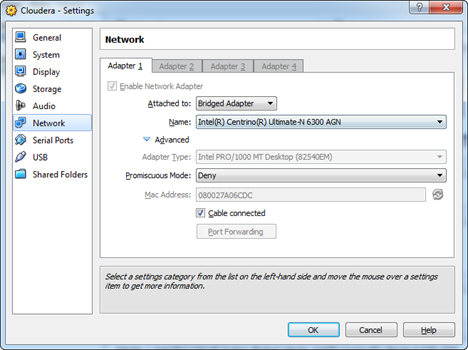
In my previous blog, I talked about Hive. Hive provides a SQL-like layer on top of Hadoop so you don't have write tons of MapReduce code to query Hadoop and to aggregate and join data. To facilitate working with Hive, Microsoft introduced a Hive ODBC driver (as of this writing, the driver is only available to Hadoop on Azure CTP subscribers). You can use this driver to connect to Hive running on Microsoft Azure or your local Hadoop server. Danny Lee has provided detailed instructions of how to do the former. I'll show you how to use it to connect to your local Hive server. Start the Hive Server If you use the Cloudera VM, the Hive server is not running by default. This service allows external clients to connect to Hive. To start it: Configure your Cloudera VM to obtain an IP address on your network. To do so...
-
Report Timeout Quest Reloaded
June 25, 2012 / No Comments »
A long time ago, I wrote a blog about possible reasons for Reporting Services reports to time out. This issue raised its head again; this time in SharePoint 2010 environment where long running reports would time out after about 2 minutes. To resolve: On each Web Front End (WFE) server, edit the web.config file of the SharePoint web application. For the default web application, the web.config file is located in C:\inetpub\wwwroot\wss\VirtualDirectories\80. Find the httpRuntime element and change the executionTimeout setting. The default value is 110 seconds. <httpRuntime maxRequestLength="51200" executionTimeout="1000"/> Save the web.config file. No need for iisreset since the ASP.NET process will apply the settings on change. As a side note, you shouldn't have such report hogs but sometimes you can't avoid them. In this case, the end users requested a report that includes pretty much all measures in the cube sliced by the dimension with the highest cardinality so...
-
MS Guy Does Hadoop (Part 3 – Hive)
June 24, 2012 / No Comments »
Writing MapReduce Java jobs might be OK for simple analytical needs or distributing processing jobs but it might be challenging for more involved scenarios, such as joining two datasets. This is where Hive comes in. Hive was originally developed by the Facebook data warehousing team after they concluded that "… developers ended up spending hours (if not days) to write programs for even simple analyses". Instead, Hive offers a SQL–like language that is capable of auto-generating the MapReduce code. The Hive Shell Hive introduces the notion of a "table" on top of data. It has its own shell which can be invoked by typing "hive" in the command window. The following command shows the Hive tables. I have defined two tables: records and records_ex. [cloudera@localhost book]$ hive hive> show tables; OK records records_ex Time taken: 4.602 seconds hive> Creating a Managed Table Suppose you have a file with the...
-
MS BI Guy Does Hadoop (Part 2 – Taking Hadoop for a Spin)
June 10, 2012 / No Comments »
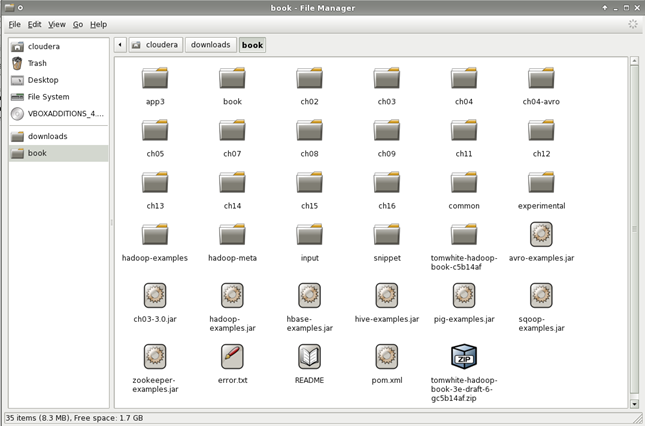
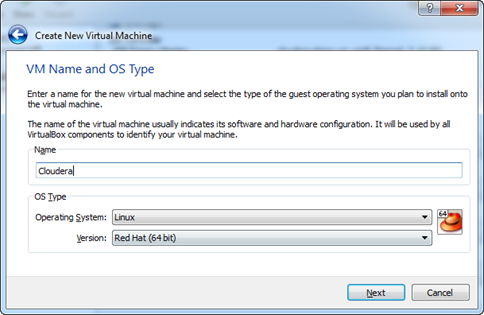
In part 1 of my Hadoop adventures, I walked you through the steps of setting the Cloudera virtual machine, which comes with CentOS and Hadoop preinstalled. Now, I'll go through the steps to run a small Hadoop program for analyzing weather data. The program and the code samples can be downloaded from the source code that accompanies the book Hadoop: The Definitive Guide (3rd Edition) by Tom White. Again, the point of this exercise is to benefit Windows users who aren't familiar with Unix but are willing to evaluate Hadoop in Unix environment. Downloading the Source Code Let's start by downloading the book source and the sample dataset: Start the Cloudera VM, log in, and open the File Manager and create a folder downloads as a subfolder of the cloudera folder (this is your home folder because you log in to CentOS as user cloudera). Then, create a folder book...
-
MS BI Guy Does Hadoop (Part 1 – Getting Started)
June 4, 2012 / No Comments »
With Big Data and Hadoop getting a lot of attention nowadays, I've decided it's time to take a look so I am starting a log of my Hadoop adventures. I hope it'll benefit Windows users especially BI pros. If not, at least I'll keep a track of my experience, so I can recreate it if needed. Before I start, for an excellent introduction to Hadoop from a Microsoft perspective, watch the talk on Big Data - What is the Big Deal? by David Dewitt. Previously, I've experimented and I got my feed wet with Apache Hadoop-based Services for Windows Azure, which is the Microsoft implementation for Hadoop in the cloud, but I was thirsty for more and wanted to dig deeper. Microsoft is currently working on CTP of Hadoop-based Services For Windows, which will provide a supported environment for installing and running Hadoop on Windows. While waiting, O'Reilly was king enough to...
Training
 We offer onsite and online Business Intelligence classes! Contact us about in-person training for groups of five or more students.
For more information or to register click here!
Books
 Learn Power BI at your own pace with our latest book Applied Microsoft Power BI. Targeting information workers, data analysts, pros, and developers, It is designed as an easy-to-follow guide for learning how to implement BI solutions spanning the entire personal-team-organizational BI spectrum.

