-
VertiPaq Rebranded as xVelocity
March 22, 2012 / No Comments »
Apparently, the name "VertiPaq" wasn't catchy enough so Microsoft rebranded it as xVelocity (probably got tipped by Comcast). This is just a name change, no new features. Glossary xVelocity: The SQL Server family of technologies that utilize in-memory columnar storage to achieve very high-performance in query processing. 1. xVelocity for Business Intelligence Introduced as VertiPaq in the SQL Server 2008 R2 release, this in-memory columnar storage technology is the analytical engine that powered PowerPivot in that release, and is now in both PowerPivot and SQL Server Analysis Services in Tabular mode for the SQL Server 2012 release. xVelocity for BI consists of: xVelocity In-memory Analytics Engine in SSAS 2012 Tabular Mode (used for enterprise-grade, scalable BI) xVelocity In-memory Analytics Engine (previously called Vertipaq) in PowerPivot (used for self-service and team-oriented BI scenarios), available in PowerPivot for Excel and SharePoint Server 2. xVelocity for Data Warehousing Memory-optimized columnar (columnstore) index technology...
-
BIDS Helper 1.6 Beta Released
March 20, 2012 / No Comments »
Fellow MVPs have just released the latest public beta build of BIDS Helper, which should one of the first utilities you install after you install SQL Server on your machine. Besides fixes and updates, this release adds support for SQL Server 2012 and new features specific to Analysis Services Tabular. This beta release is the first to support SQL Server 2012 (in addition to SQL Server 2005, 2008, and 2008 R2). Since it is marked as a beta release, we are looking for bug reports in the next few months as you use BIDS Helper on real projects. In addition to getting all existing BIDS Helperfunctionality working appropriately in SQL Server 2012 (SSDT), the following features are new. Analysis Services Tabular Smart Diff Tabular Actions Editor Tabular HideMemberIf Tabular Pre-Build
-
Hiding SQL Server 2012 Reporting Services Extensions in SharePoint
March 15, 2012 / No Comments »
To continue my Report Server Settings in SQL Server 2012 SharePoint Integration Mode blog, here is another example of how to use the new PowerShell-based configuration mechanism to hide a rendering extension. In this case, the script finds an SSRS application called SQL Server SSRS (replace with the name of your SSRS application from SharePoint Central Admin) and hides the XML renderer so the XML export option doesn't appear in the Actions drop-down. $apps = Get-SPRSServiceApplication | where {$_.name -like "SQL Server SSRS"} Set-SPRSExtension -identity $apps -ExtensionType "Render" -name "XML" -ExtensionAttributes "<Visible>False</Visible>"
-
Can’t Activate Reporting Services Service in SharePoint
March 15, 2012 / No Comments »
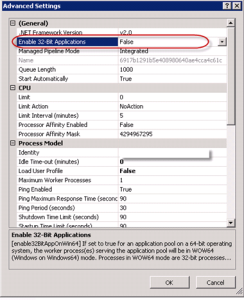
I upgraded SQL Server 2012 from RC0 to RTM today on a SharePoint application server which was configured for Reporting Services integration. The upgrade went with no errors but I got this error when requesting reports: The requested service, 'http://amatltapp02:32843/1dacf49a2f7a4a6daa8db5768539893f/ReportingWebService.svc' could not be activated. See the server's diagnostic trace logs for more information. The requested service, 'http://amatltapp02:32843/1dacf49a2f7a4a6daa8db5768539893f/ReportingWebService.svc' could not be activated. See the server's diagnostic trace logs for more information. And, when browsing directly the service: After some digging out, we solved the issue by changing the Enable 32-Bit Applications property of the IIS application pool for the SharePoint web application to False. Server Error in '/1dacf49a2f7a4a6daa8db5768539893f' Application. The farm is unavailable.
-
Presenting at SQL Server Special Ops Tour Atlanta
March 2, 2012 / No Comments »
I've been honored to be selected by Microsoft to present the Self-service BI using PowerPivot and Power View session for the SQL Server Special Ops Tour in Atlanta on Monday, March 5th. EVENT AGENDA Agenda Speaker 12:30pm – 1:30pm Registration Opens 1:30pm – 2:30pm SQL Server 2012 – The New World of Data Dandy Weyn – FTE – Sr. Tech Prod Mgr 2:30pm – 3:15pm Introduction to SQL Server 2012 AlwaysON – Availability Groups Geoff Hiten – MVP – Community 3:15pm – 3:30pm Break – drinks and light snacks 3:30pm – 4:15pm Self-Service BI using PowerPivot and Power View Teo Lachev – MVP – Community 4:15pm – 4:45pm Understanding Microsoft Training & Certifications for Microsoft SQL Server 2012 Bob Taylor – FTE – Principal PFE 4:45pm – 5:15pm In Summary All speakers Join us to celebrate SQL Server 2012!
-
Finding Reporting Services Service in SharePoint
March 2, 2012 / No Comments »
SharePoint is a like an ocean – the further you go, the deeper it gets Ancient proverb Scenario: Configure SQL Server 2012 Reporting Services on a multi-server SharePoint farm with the following topology: WEB1 – Web front-end Server 1 WEB2 – Web front-end Server 2 APP1 – Application server 1 that hosts the Central Administration site APP2 – Needs SSRS 2012 APP2 – Needs SSRS 2012 Issue: I couldn't find the SQL Server Reporting Services Service Application option when I expanded the New button in Central Administration ð Manage Service Applications Resolution: Although the SQL Server 2012 Reporting Services service and Reporting Services Add-in were installed on APP2 and APP3, the SQL Server Reporting Services service wasn't registered at a farm level. As a result, I couldn't find the SQL Server Reporting Services Service in Central Admin -> Manage Services on Server on none of the application servers. As it...
-
Presenting Personal BI with PowerPivot v2
February 23, 2012 / No Comments »

I'll be presenting "Personal BI with PowerPivot v2" for the Atlanta BI Group on Monday, February 27th. Join us to learn when personal BI makes sense and why PowerPivot is the best tool on the market when it does. The focus will be on the new features of PowerPivot version 2 which launch officially in a week or so. For more information and to register visit our Atlanta BI home page.
-
Announcing My New Book
February 11, 2012 / No Comments »
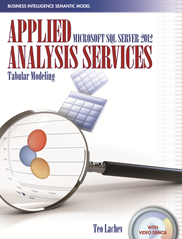
My new book, Applied Microsoft SQL Server 2012 Analysis Services (Tabular Modeling), will start shipping in a week with all popular resellers, such as Amazon, B&N, etc. I've been working on it for a few months and I'm excited to have it done. While waiting to buy the book, check the following resources to get you started with PowerPivot and Tabular: - A sample chapter – "Introducing Business Intelligence Semantic Model" - Video demos – I recorded over three hours of video content for selected exercises in the book An insightful tour that provides an authoritative yet independent view of this exciting technology, this guide introduces the Tabular side of the innovative Business Intelligence Semantic Model (BISM) that promotes rapid professional and self-service BI application development. Business analysts and power users will learn how to integrate data from multiple data sources, implement self-service BI applications with Excel, and deploy them...
-
ProcessUpdate and Partition Scans
February 7, 2012 / No Comments »
I'm working on minimizing the cube processing for a cube with some two billion rows in a fact table. I put together an ETL package that processes the dimensions with ProcessUpdate following by processing the latest partitions. I've noticed that processing one of the dimensions , which happens to be the largest (some 1 million rows) and most complicated dimension, resulted in partitions scans. The SQL Profiler showed the scans with the following events: Finished processing the '<partition name>' partition These partition scans don't result in SQL queries to the database and normally should execute pretty fast. In this case, however, the scans were taking plenty of time resulting in some 15 minutes delay in the incremental processing flow. With some help from T.K. Anand, it turned out that I had a design issue with that dimension. I discovered the issue by changing the KeyDuplicate error in the dimension ErrorConfiguration...
-
Record Attendance for Atlanta BI Group Last Night
February 1, 2012 / No Comments »
We had the pleasure to have some 70 people attending our January 30th, 2012 meeting of the Atlanta BI group. Our sponsor, Matrix Resources, was kind enough to give us the auditorium. FisionIO sponsored the meeting. Phil Per-Lee did us a "Prototypes with Pizza" presentation, titled Connecting the Dots. And, Carlos Rodrigues rocked the stage with the main presentation about dimensional modeling. I've uploaded pictures to the Photo Gallery section of our website and the slides to the Resources section. We've got some cool presentations lined up for next few months. Check our Calendar section to see what's coming.
Training
 We offer onsite and online Business Intelligence classes! Contact us about in-person training for groups of five or more students.
For more information or to register click here!
Books
 Learn Power BI at your own pace with our latest book Applied Microsoft Power BI. Targeting information workers, data analysts, pros, and developers, It is designed as an easy-to-follow guide for learning how to implement BI solutions spanning the entire personal-team-organizational BI spectrum.

