-
Is Excel Calculation Services Needed on a PowerPivot for SharePoint Application Server?
June 2, 2012 / No Comments »
Scenario: A SharePoint 2010 scale-out farm with two application servers: APP1 – Runs Excel Calculation Services (ECS) APP2 – Runs PowerPivot for SharePoint (R2 or 2010) Do you need to start ECS on APP2 in order for PowerPivot for SharePoint to work? Answer: You don't but if you don't have the updated Analysis Services OLE DB Provider on APP01, you'll get the dreaded "Failed to create new connection…" error when you browse the PowerPivot workbook. SharePoint ships with the SQL 2008 ADO MD, MSOLAP, etc. stack; not the R2 or later components. Therefore, you must upgrade the OLE DB provider (R2 or 2010 depending on the PowerPivot version) as explained in the How to: Install the Analysis Services OLE DB Provider on an Excel Services Computer topic in Books Online. Thanks to Dave Wickert for clarifying this.
-
Organizational BI vs. Personal BI
May 27, 2012 / No Comments »
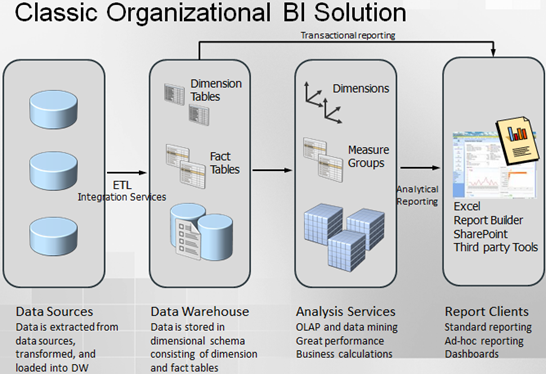
This is a blog post that I've been planning for a while. With the ever-increasing power of laptops and desktop computers and declining hardware prices, personal BI is on the rise. Typically, a new technology usually has a self-propelled upward spiral to a point – vendors are talking about it to clients, executives are talking about it on golf courses, consultancies are talking about it, and are rushing to fill in the void. There is a lot of money to be made with a lot of misinformation and sometimes outright lies. I'll be quick to point out that personal BI alone is not going to fix your BI and data challenges. However, it can complement organizational BI well and open possibilities when organizational BI alone is not enough. You might find the following information interesting when you're contemplating which way to go. Organizational BI Organizational BI is a set of...
-
Why an Analytical Layer?
May 26, 2012 / No Comments »
I had a presentation on the BI Semantic Layer and Tabular modeling for the Atlanta BI Group on Monday. Midway during the presentation, a DBA asked why we need an analytical layer on top of data. I'm sure that those of you who are familiar with traditional reporting and haven't discovered yet Analysis Services might have the same question so let's clarify. Semantic layer In general, semantics relates to discovering the meaning of the message behind the words. In the context of data and BI, semantics represents the user's perspective of data: how the end user views the data to derive knowledge from it. As a modeler, your job is to translate the machine-friendly database structures and terminology into a user-friendly semantic layer that describes the business problems to be solved. To address this need, you create a semantic layer. In the world of Microsoft BI, this is the Business...
-
Presenting at Atlanta BI Group
May 19, 2012 / No Comments »
I'll be presenting "The Analysis Services 2012 Tabular Model" for the Atlanta BI Group on Monday, May 21st. And, Darren Herbold will share some great insights harvested from a real-life project of how to use SSIS to integrate with Salesforce.com. I hope you can make the event, which will be sponsored by Prologika. "SQL Server 2012 introduces the BI Semantic Model that gives BI pros two paths for implementing analytical layers: Multidimensional and Tabular. The Tabular model builds upon the xVelocity engine that was introduced in PowerPivot. Although not as feature-rich as Multidimensional, Tabular promotes rapid professional development and great out-of-box performance. This session introduces you to Tabular development and shares lessons learned. I'll also discuss how Tabular and Multidimensional compare."
-
Analysis Services Processing and CXPACKET Waits
May 15, 2012 / No Comments »

Performance tuning – my favorite! This blog originated from a quest to reduce the processing time of an SSAS cube which loads some 2.5 billion rows and includes DISCINTCT COUNT measure groups. The initial time to fully process the cube was about 50 minutes on a dedicated DELL PowerEdge R810 server, with 256 GB RAM and two physical processors (32 cores total). Both the SSAS and database servers were underutilizing the CPU resources with SSAS about 60-70 utilizations and the database server about 20-30 CPU utilization. What was the bottleneck? By using the sys.dm_os_waiting_tasks DMV like the statement below (you can use also the SQL Server Activity Monitor), we saw a high number of CXPACKET wait types. SELECT dm_ws.wait_duration_ms, dm_ws.wait_type, dm_es.status, dm_t.TEXT, dm_qp.query_plan, dm_ws.session_ID, dm_es.cpu_time, dm_es.memory_usage, dm_es.logical_reads, dm_es.total_elapsed_time, dm_es.program_name, DB_NAME(dm_r.database_id) DatabaseName, -- Optional columns dm_ws.blocking_session_id, dm_r.wait_resource, dm_es.login_name, dm_r.command, dm_r.last_wait_type FROM sys.dm_os_waiting_tasks dm_ws INNER JOIN sys.dm_exec_requests dm_r ON dm_ws.session_id = dm_r.session_id...
-
SQL Server 2012 ETL Framework Features in the New SSIS Project Deployment Model
April 29, 2012 / No Comments »
When moving to SQL Server 2012, ETL developers would need to rethink custom ETL frameworks. If you embrace the new project deployment model, SQL Server 2012 offers a lot of plumbing features out of the box. Jen Underwood wrote a great SQL Server 2012 ETL Framework Features in the New SSIS Catalog article about what supported and what's missing. I guess in most cases developers will find that they'll need to implement incremental features on top of the Microsoft provided toolset that are not supported, such as restartability and execution control, while letting SSIS 2012 handle logging and performance reporting. Another great resource for getting started with the new project deployment model is the SSIS Logging in Denali blog by Jammie Thompson. We ran into an interesting snag when validating and executing packages using the new project deployment model with Windows integrated security: Developer initiates the validation and execution in...
-
Reducing Analysis Services Index Processing Time
April 15, 2012 / No Comments »
Scenario: Processing a 100 GB SSAS 2012 cube on a dedicated DELL PowerEdge server (128 GB RAM with 32 logical cores) reveals that 50% of the time is spent on processing the cube indexes and building aggregations with only 20% average CPU utilization and not even a small dent to the memory consumption. It was clear that SSAS doesn't utilize the server resources and additional tuning is required to increase the parallelism of this phase. Solution: Following Greg Galloway's advice, we've changed the OLAP\Process\AggregationMemoryLimitMin to 2 and OLAP\Process\AggregationMemoryLimitMin to 3 to increase the parallelism of the index processing. This led to 25% reduction of the overall processing time and increased the CPU utilization to 70-80%. As to how we derived to these numbers, James Rogers has a great write-up. For the sake of preserving the precious formulas: AggregationMemoryLimitMax=Ceiling(100/(<number processing cores>-2)) AggregationMemoryLimitMin=Ceiling(100/((<number processing cores>-2)*1.5)) In case you're curious about what these...
-
Presenting at SQL Saturday
April 9, 2012 / No Comments »
I have a talk "The Personal-Team-Organizational BI Conundrum" at SQL Saturday on April 14th at 9 AM. Confused about the BI alphabetical soup? Not sure which one makes sense for your organization? Join this session to learn you can use the Microsoft BI platform to address various analytical needs. Discover how to implement the Personal-Team-Organizational continuum on a single platform. I'll also discuss how Tabular and Multidimensional compare. I hope you can make it. SQL Saturday is always a good show and this year we have great speakers and great BI content.
-
Report Builder Connectivity Issues
March 28, 2012 / No Comments »
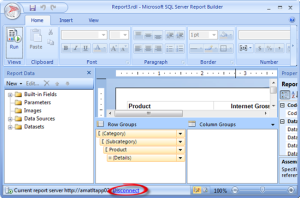
Issue: Previewing a Report Builder report connected to Analysis Services works in Report Designer but it fails in Report Builder 3.0 with the following error: An existing connection was forcibly closed by the remote host ---------------------------- Unable to read data from the transport connection: An existing connection was forcibly closed by the remote host. ---------------------------- Further, SQL Profiler reveals that an Anonymous connection is attempted to Analysis Services even though you use an embedded report data source (using a shared data source on the server will run the report on the server while with an embedded data source results the report runs on the client). Resolution: Check if Report Builder is connected to a report server running in SharePoint mode by examining the status bar. If it is, click the Disconnect link. Report preview should now work.
-
Finding Source Column Names in PowerPivot
March 28, 2012 / No Comments »
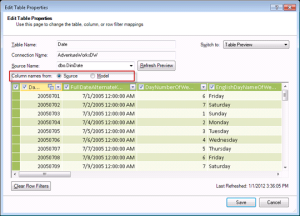
Question: How do I find the source column name in PowerPivot if I've renamed and moved columns around? Answer: Assuming that the table doesn't use a custom query to import data or it wasn't derived from an Excel linked table or Windows Clipboard, you can use the table properties to find the source column name as follows: In the PowerPivot Window, click the table to select it. In the Design ribbon tab, click Table Properties. Make sure that the Column Names From radio button is set to Source.
Training
 We offer onsite and online Business Intelligence classes! Contact us about in-person training for groups of five or more students.
For more information or to register click here!
Books
 Learn Power BI at your own pace with our latest book Applied Microsoft Power BI. Targeting information workers, data analysts, pros, and developers, It is designed as an easy-to-follow guide for learning how to implement BI solutions spanning the entire personal-team-organizational BI spectrum.

