-
Where is x64 Excel 2010 Data Mining Add-in?
October 12, 2010 / No Comments »
Mark Tabladillo delivered a great presentation about using Excel for data mining at our last Atlanta BI SIG meeting. The lack of an Excel 2010 x64 DM add-in came up. There was a question from the audience whether Microsoft has abandoned DM technology since it stopped enhancing it. A concern was also raised that Microsoft might have also neglected the corporate BI vision in favor of self-service BI. That's definitely not the case. I managed to get a clarification from the Microsoft Analysis Services team that Corporate BI will be a major focus in "Denali", which is the code name for the next version of SQL Server – version 11. As far as the long-overdue x64 DM add-in for Excel, Microsoft is working on it and it will be delivered eventually. Meanwhile, the 2007 add-in works with the x32 version of Excel 2010. For those of you going to SQL...
-
Prologika Training Classes
October 5, 2010 / No Comments »
Our online classes for the remainder of 2010: Courses Mentor Date Price Applied SSRS 2008 Teo Lachev 10/26-10/29 12:00-5:00 EDT $799 Register Applied SSAS 2008 Teo Lachev 11/23-11/25 12:00-5:00 EDT $799 Register Applied PowerPivot Teo Lachev 11/29-11/30 12:00-4:00 EDT $599 Register Visit our training page to register and more details.
-
MVP For Another Year!
October 1, 2010 / No Comments »
Just got the news that my MVP status got extended for another year! This will make it six consecutive years as MVP and as a member of an elite group of professionals that I am proud of belonging to.
-
Atlanta BI SIG September Meeting
September 25, 2010 / No Comments »
Atlanta BI fans, join our next Atlanta BI SIG meeting! Mark Tabladillo (Ph.D., Industrial Engineering, MCAD.NET, MCT) will show us how to do data mining with PowerPivot. And Dundas will demonstrate their latest BI offering – the Dundas dashboard. Here are the details: Please RSVP to help us plan food as follows: Go to the Atlanta BI home page (atlantabi.sqlpass.org). Choose Yes and submit the RSVP survey found at the right top corner of the page. Main Topic: Data Mining with PowerPivot 2010 Level: Intermediate Date: Monday, September 27, 2010 Time: 6:30PM Location Matrix Resources 115 Perimeter Center Place Suite 250 (South Terraces Building) Atlanta, GA 30346 Speaker: Mark Tabladillo (Ph.D., Industrial Engineering, MCAD.NET, MCT) Mark Tabladillo provides consulting and training for data mining with Solid Quality Mentors. He has taught statistics at Georgia Tech and for the graduate business school of the University...
-
Analysis Services Processing Performance
September 20, 2010 / No Comments »
Analysis Services has a very efficient processing architecture and server is capable of processing rows as fast as the data source can provide. You should see processing rate in the ballpark 40-50K rows/sec or even better. One of my customers just bought a new shiny HP ProLiant BL680c server only to find out that processing time went three times higher than the old server. I did a simple test where I asked to execute the processing on both the old server and the new server. The query on the old server would return all rows within 2 minutes, while the same query would execute for 20 minutes which averages to about 4K rows processed/sec. This test ruled out Analysis Services right off the bat. It was clear that the network is the bottleneck. Luckily, the server had a lot of processing power, so processing wasn't ten times slower. As it...
-
DynamicHeight Bug
September 16, 2010 / No Comments »

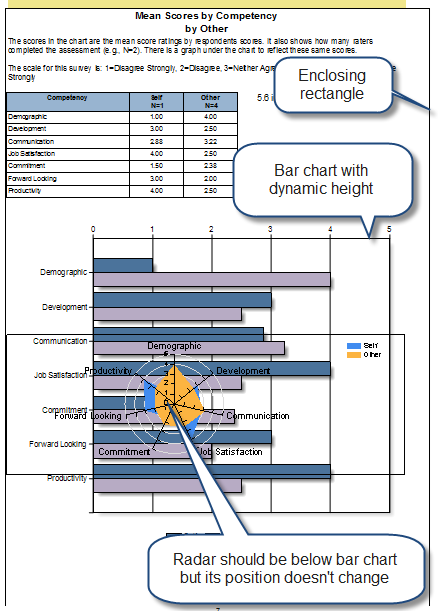
The chart region in Reporting Services 2008 introduced the ability to dynamically size charts by setting the DynamicHeight and DynamicWidth properties, as Robert Bruckner explained in his blog. This feature is really useful and I hope one day it makes to the other regions as well. A customer recently reported an issue with their reports where regions would overlap when the report is previewed in Print Layout mode or exported to a hard page renderer, such as PDF. For example, in the report below the radar chart is positioned after the bar chart in RDL. However, in Print Layout preview the radar chart overlaps the bar chart. The customer tried every possible combination to enclose one or more regions in rectangles which helped avoiding the overlapping issue to some degree but introduced other issues. After some digging, I discovered that the issue is caused by the fact that the bar chart...
-
Importing SSAS KPIs in PerformancePoint
September 7, 2010 / No Comments »

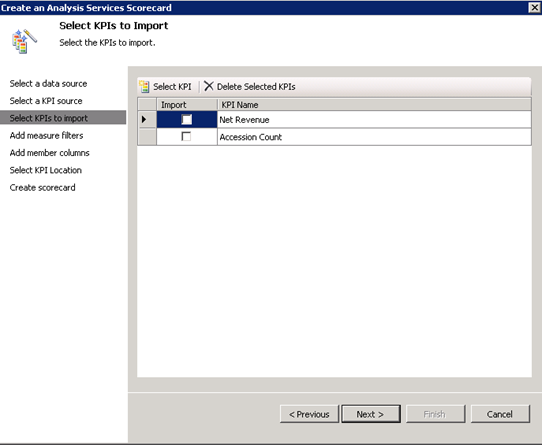
Forging ahead through the unchartered land of PerformancePoint 2010, I ran into a snag today. Attempting to import Analysis Services KPIs resulting in the following error: An unexpected error occurred. Error 47205. Exception details: System.IO.FileNotFoundException: Could not load file or assembly 'Microsoft.AnalysisServices, Version=10.0.0.0, Culture=neutral, PublicKeyToken=89845dcd8080cc91' or one of its dependencies. The system cannot find the file specified. File name: 'Microsoft.AnalysisServices, Version=10.0.0.0, Culture=neutral, PublicKeyToken=89845dcd8080cc91' at Microsoft.PerformancePoint.Scorecards.Server.ImportExportHelper.GetImportableAsKpis(DataSource asDataSource) at Microsoft.PerformancePoint.Scorecards.Server.PmServer.GetImportableAsKpis(DataSource dataSource) Since in our case, PerformancePoint was running on a SharePoint web front end server (WFE) which didn't have any of the SQL Server 2008 components installed, it was clear that PerformancePoint was missing a connectivity component. Among many other things, I tried installing the Analysis Services Management Objects (AMO) from the SQL Server 2008 Feature Pack but the error won't go away. I fixed it by running the SQL Server 2008 setup program and installing the Client Tools Connectivity...
-
PerformancePoint 2010
September 3, 2010 / No Comments »

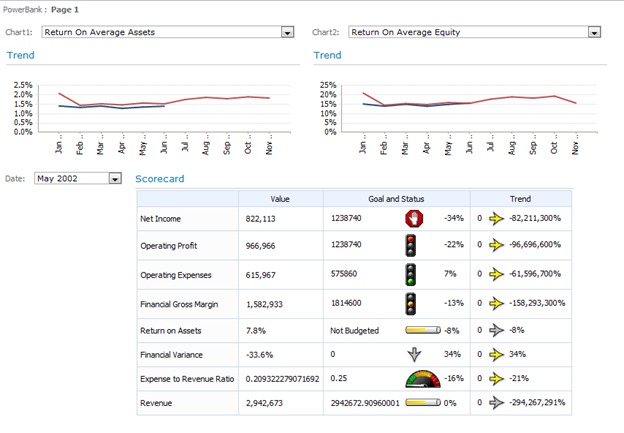
PerformancePoint? Is it still around? It is (in SharePoint 2010), and it should peak your interest if you are serious about dashboarding. The planning component is of course gone and I have to admit I never had too much faith in it. When comes to dashboards, Microsoft gives you two implementation options: Reporting services reports in SharePoint web parts – Pros include low cost because Reporting Services is available with SharePoint Foundation, and no need to learn new skills. On the downside, you need to implement your own global filter web parts assuming that you don't use SharePoint Server. PerformancePoint – This is tool specifically designed for dashboards and it just got better in SharePoint 2010. However, it requires SharePoint Server 2010 which you need for PowerPivot as well. Unfortunately, this puts you in the $5,000+ upfront investment bucket (Vidas has more to say about SharePoint pricing). Personally, I was...
-
Kerberos Woes
August 23, 2010 / No Comments »
[Wikipedia] Cerberus, (pronounced /ˈsɜrb(ə)rəs/);[1] Greek form: Κέρβερος, /ˈkerberos/[2] in Greek and Roman mythology, is a multi-headed hound (usually three-headed) which guards the gates of Hades, to prevent those who have crossed the river Styx from ever escaping. I think Microsoft got the name right although the Windows version of Kerberos has more than three heads for sure. Yet another weekend spent in troubleshooting Kerberos. This one has an interesting setup. SharePoint Server 2010 on a Web Front End (WFE) box. SharePoint Server 2010 (core install) + SQL Server and Reporting Services 2008 integrated with SharePoint on a second box. Analysis Services 2008 R2 on a third box. The customer wanted this setup to minimize the SQL Server licenses. Microsoft recommends installing Reporting Services on the WFE servers but this requires as many SQL Server licenses as the number of the WFE servers, plus probably two more (for SQL Server to...
-
Applied PowerPivot Course Available
August 23, 2010 / No Comments »

I am excited to announce that Prologika has added an Applied PowerPivot course to the list of our training offerings in response to the strong interest for self-service BI. The class can be delivered as two-day online class (4 hours each day) or as one full-day onsite class. The cost for the online version is $599. Applied PowerPivot is designed to help students become proficient with PowerPivot and acquire the necessary skills to implement PowerPivot applications, perform data analysis, and share these applications with other users. The full course syllabus is available here. I scheduled the first run for September 21st. Happy self-service BI!

 We offer onsite and online Business Intelligence classes! Contact us about in-person training for groups of five or more students.


