-
Applied Power BI Book (4th Edition)
December 31, 2018 / No Comments »
I'm excited to announce the fourth edition of my Applied Microsoft Power BI book! When the original book was published in January 2016, it was the first Power BI book at that time and it had less than 300 pages. Since then, I helped many companies adopt or transition to Power BI and taught hundreds of students. It's been a great experience to witness the momentum surrounding Power BI and how the tool matured over time. As a result, the book got thicker too and it now stands at 500 pages. However, I believe what's more important is that this book provides systematic, yet dependent, view by showing what Power BI can do for four types of users (business users, analysts, pros, and developers). This is the only Power BI book that gets annual revisions to keep it up to date with this ever changing technology! Because I had to draw a...
-
Power BI External Users and Data Security
December 28, 2018 / No Comments »

Power BI lets you share content directly with external users for B2B and B2C scenarios. When the benefits of this sharing option outweigh its limitations (read-only reports, requiring Azure AD federated access, per-user licensing, rendering the report inside Power BI), this is the easiest way to share Power BI content with an external party. However, the documentation, which is otherwise excellent, doesn't explain the steps required to allow the external user to see only a subset of data when you have a dataset configured for data (RLS) security. Granting access to an external user to a dataset configured for data security is like the proverbial chicken and egg problem. To grant access to the report, you need to share the report with the user, but you can't add the user to the security role because the user is not provisioned yet. Hence, you'll first share a non-sensitive report with the...
-
Expression-based Formatting in Power BI
December 15, 2018 / No Comments »
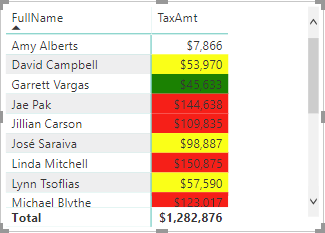
If you have used SSRS, you know that paginated reports are very customizable, and you can make almost any property expression-based. Power BI is yet to deliver expression-based properties to change settings based on runtime condition, such as to change the font style based on the actual value or user selection. Currently, there are two places where you can use a DAX measure for expression-based formatting of colors: Conditional formatting You can use a DAX measure to change the fore color or background color when you apply conditional formatting to cells in Table and Matrix reports. To do so, when you configure the conditional formatting settings, choose the Field Value option. In the following report, I used a DAX measure to format the TaxAmount field with the following formula: TaxColor = SWITCH(TRUE(), SUM(ResellerSales[TaxAmt])> 100000, "Red", SUM(ResellerSales[TaxAmt])>50000,"Yellow", SUM(ResellerSales[TaxAmt])>10000,"Green", BLANK()) Although the measure defines three bands of colors, which you can do...
-
Are You Modern Yet?
November 28, 2018 / No Comments »
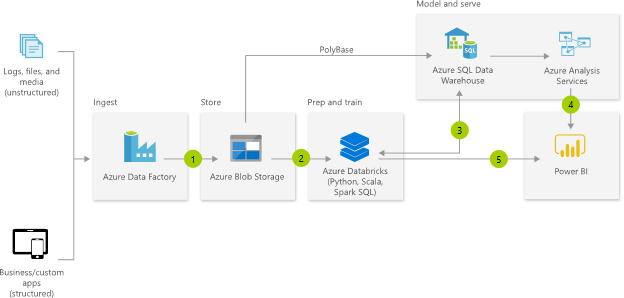
If you're a BI architect responsible for designing Azure-based cloud BI solutions and you're not following the James Serra's blog, you're missing a lot. Previously an independent consultant and MVP, James works now as a Big Data/Data Warehouse Evangelist at Microsoft. I can't agree more with his latest blog "Should I load structured data into my data lake?" We've heard a lot lately about what the "modern" data warehouse architecture should look like from Microsoft and other vendors. Here is the diagram taken from, you guessed it, the Microsoft Modern Data Warehouse page. The problem is that many organizations take this diagram verbatim when it makes sense and when it doesn't. For example, a client exports data from on-premises relational databases to text files in Azure Data Lake, only to load it later in a cloud data warehouse. To my observation that this is redundant and pointless, they answered that...
-
Atlanta MS BI and Power BI Group Meeting on December 3th
November 26, 2018 / No Comments »

MS BI fans, join us for the next Atlanta MS BI and Power BI Group meeting on December 3th, Tuesday at 6:30 PM at the Microsoft office in Alpharetta. I will discuss Power BI dataflows. A3 will sponsor the event. For more details, visit our group page and don't forget to RSVP (use the RSVP survey on the main page) if you're planning to attend. Presentation: Understanding Power BI Dataflows Date: December 3, 2018, Monday Time 6:30 – 8:30 PM ET Place: Microsoft Office (Alpharetta) 8000 Avalon Boulevard Suite 900 Alpharetta, GA 30009 Overview: If you're a business user, you might know about Microsoft Flow. If you're a BI pro, you might have used the SSIS Control Flow and Data Flow. But do you know about the Power BI dataflow? Data preparation is often the most labor-intensive component of an analytics project and getting this right is vital if the results are to be...
-
Dataflows: The Good, the Bad, the Ugly
November 16, 2018 / No Comments »
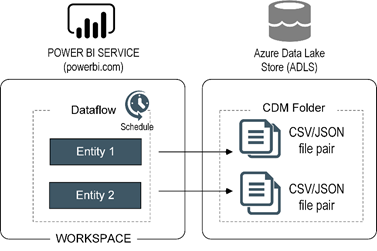
This blog is an update of my previous blog "Common Data Service for Analytics: The Good, the Bad, the Ugly". Things have changed in the past 6 months. The Common Data Service for Analytics is no more. It got superseded by Power BI dataflows, which Microsoft officially introduced at the PASS Summit last week. Think of dataflows as "Power Query in the Cloud". Dataflows is to self-service BI what ETL is to Power BI pros. A dataflow is a collection of Power Query queries, also known as entities, and it lives in a Power BI organizational workspace. For example, if I want to stage data from Salesforce, I can create a dataflow with as many entities as Salesforce tables I want to stage. Unlike Power Query, which can only output to a table in a data model, a dataflow saves its output as a pair of a CSV file (data)...
-
Atlanta MS BI and Power BI Group Meeting on October 30
October 25, 2018 / No Comments »

MS BI fans, join us for the next Atlanta MS BI and Power BI Group meeting on October 30th, Tuesday at 6:30 PM at the Microsoft office in Alpharetta. Neal Waterstreet will tackle the important and pervasive issue of bad data quality. ZAP BI will sponsor the event. And your humble correspondent will introduce you to Power BI Home and data profiling. For more details, visit our group page and don't forget to RSVP (use the RSVP survey on the main page) if you're planning to attend. Presentation: Data Quality - Plain and Simple Date: October 30, 2018, Tuesday Time 6:30 – 8:30 PM ET Place: Microsoft Office (Alpharetta) 8000 Avalon Boulevard Suite 900 Alpharetta, GA 30009 Overview: Data quality is a subject that comes up repeatedly in many organizations. Most executives are concerned about the quality of the information used in their decisions. We talk about "good data" and "bad data" but...
-
Power BI Release Notes
October 24, 2018 / No Comments »

Want to know what Power BI features are in the works and when they will be released? My "Power BI Features Report" showed you how to find what features were released over time so it's retrospective. On the other hand, Business Applications Release Notes are forward looking. For example, the October release notes for BI go all the way to March 2019. The release notes are for all business apps (not just Power BI): Dynamics, BI, PowerApps, Flow, AI, and others. There is also a change log.
-
Taking the Most Out of Linked Servers
October 21, 2018 / No Comments »

What's the first thing that comes to mind when you hear "linked server"? Performance issues or a snail image, right? Many developers don't like linked servers because they are "slow" although they rarely bother to investigate the underling issue, much less to fix it. Linked servers are a very useful and commonly used feature of SQL Server. They allow SQL Server to query external data sources, such as Oracle and DB2, and to present these data sources as SQL Servers to upstream systems. A query that involves a linked server is called a distributed query. The most common issue with a distributed query is that it doesn't "remote". In other words, while you expect the entire query (or parts of it) to be executed on the remote server, SQL Server downloads the data locally and then performs filters or joins. This could be very expensive with large tables, hence the...
-
Power BI Data Profiling
October 15, 2018 / No Comments »
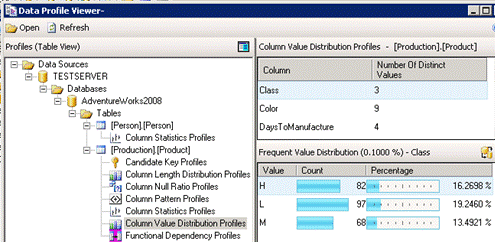
You know it and I know it. Data quality is a BIG problem that reduces the business value of BI. ETL practitioners will probably recall that SSIS includes a comprehensive Data Profiling Task but it is somewhat difficult to set up, especially if you wanted to profile multiple tables. It saves the results in an xml file and then you could use the Data Profile Viewer to visualize the results. Can we do something like this in Power BI? Starting with Power BI Desktop (October 2018) release you can. Well, sort of. Once you enable the column profiling preview feature, open the query behind any table and enable these options in the View ribbon. You'll get basic statistics showing the percentages of Valid, Error, and Empty values out of the sample size (the first 1,000 values). Here are definitions of these categories: Valid - Non-Error and Non-Empty values out of...

 We offer onsite and online Business Intelligence classes! Contact us about in-person training for groups of five or more students.